SLIDE 1
Sensitivity Studies
SLIDE 2
Wind tunnel simulations
Alan Robins, Paul Hayden, Hong Cheng, Matteo Carpentieri, Sando Baldi, Paolo Giambini, Tom Lawton, James Hamilton, Alex Nicolson, Nadia Bahar, James Fabian, Khaled Bashiti, et al Content: The EnFlo Wind tunnel Comparisons with field data Flow and dispersion characteristics Sensitivity studies Conclusions
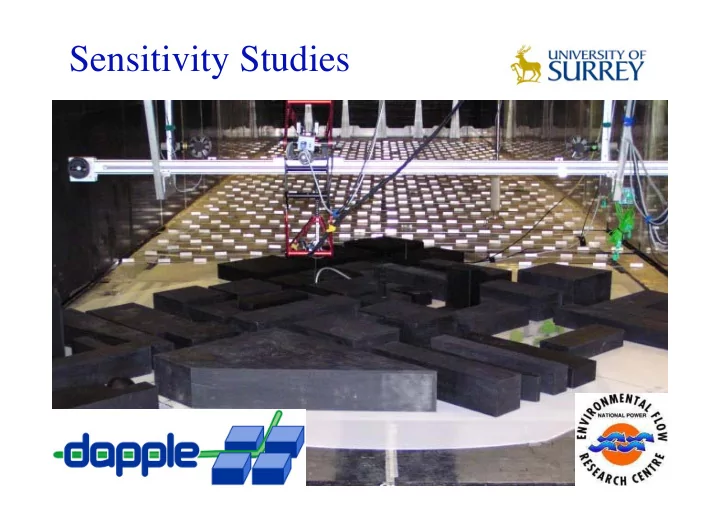
SLIDE 3 18 channel air sampling system FID system Flow control system Chilled water supply ~ 10oC Inlet and heater section - 15 layers 400 kW capacity; ambient to ~ 80oC 20 x 3.5 x 1.5 m working section 0 - 4 m/s Mechanical simulation devices Twin fans Heat exchanger Cooled rough wall ~ 10oC Gas supplies Heater control Source Rough wall Computerised control, data collection & data analysis Thermo- couple system Speed control Traverse and turntable control
The EnFlo wind tunnel
SLIDE 4
Wind speed ratios
Ratio of BT Tower and WCL roof top wind speeds High wind speed limit is about 1:4 essential data for relating wind tunnel and field data
SLIDE 5 Comparison of concentrations
The scatter is mainly due to the large repeat variability in the field data.
C* = CUH 2 Q
SLIDE 6
Component along Marylebone Rd, Ut relative to Uref
Comparison of flow fields
Data from WCC House (at 18 m), U(BT) > 3 ms-1 Ut Uref
SLIDE 7
Component normal to Marylebone Rd, Un relative to Uref
Comparison of flow fields
Data from WCC House (at 18 m), U(BT) > 3 ms-1 Un Uref
SLIDE 8 Flow structure at an intersection
Mean velocity vectors at height of 5 m
- extract from full data set
Clarification of physical processes in support of field measurements
SLIDE 9
Wind at 45 degrees to street Δx ~ W at location of measurements Emission released upstream at street centre - dispersion prior to uniform mixing across the street Concentration contours in cross-section; H/W≈1.0 roof level roof level
Near-source concentrations in helical circulation
SLIDE 10 Short Duration Emissions
Uc ≈ UH/4
Characterisation of advection speed, Uc, and along wind mixing.
ΔT50 ≈ T50/3 Time of flight, T50 - rise
Rise time, ΔT50
7.5(R/H) 2.5(R/H)
SLIDE 11 Concentration decay
The basic mean concentration decay function, CUH2/Q = 12 (R/H)-2
not fully mixed
R is source- receptor separation Concentration, C* = CUH2/Q Separation, R/H
SLIDE 12 Fluctuation levels
Separation, R/H Concentration fluctuation, c'/Cmax instrument noise level
Concentration, C* Time, s
SLIDE 13
Wind tunnel research
EnFlo 20x3.5x1.5 boundary layer wind tunnel 0 to 3.5 m/s; inlet flow heating; surface heating and cooling
Sensitivity studies examples
SLIDE 14
Basic sensitivity studies
Dispersion repeat run to run variability better than ±10% - so take ± 20% as the target for singificant effects On this basis, results shown to be insensitive to: modest variations in upwind boundary layer conditions including slightly stable approach flow (LMO ~ Hbl ~ 1 m) addition of roof roughness modification to zero-plane level at upwind edge of model source design and emission rate (speed ratio) Reynolds, U(H)H/ν, number from about 2,000 to 14,000
SLIDE 15 Comparison of results from low and higher resolution models; significant differences confined to short ranges.
SLIDE 16
Model detail
SLIDE 17
- 2. Street blockages - ineffective
SLIDE 18 Reference; blockage at A, B or C; blockage at A, B & C. Green, reference; blue, blockage at A; red, at D; yellow at A & D. Wind direction
Wind direction
Street blockage
Concentrations along Marylebone Road
SLIDE 19
- 3. Street blockage - effective
blockage source Wind direction
9 7
SLIDE 20 Wind direction
Blockage
Run 7, York St a canyon from west of Upper Montagu Street to east of Gloucester Place Run 9, Gloucester Place closed at York Street 9 7 CUref Hbl
2
Q x(mm) basically the same not these
SLIDE 21
1:200 scale model 1:500 scale model
SLIDE 22
Scale effects
CU(H)H2/Q along Marylebone Road, source York Street 1:200 scale 1:500 scale Distance from intersection, m CU(H)H2/Q
SLIDE 23
- 5. Slightly unstable approach flow
Unstable Hbl/LMO ~ -2.7, u*/Uref = 0.10 Neutral u*/Uref = 0.06
w'2 Uref
2
w'2 Uref
2
SLIDE 24 Marlylebone Rd
0.00E+00 5.00E+00 1.00E+01 1.50E+01 2.00E+01 2.50E+01 3.00E+01
200 400 600 800 1000 X mm CUA/Q
Unstable Neutral
Slightly unstable approach flow
CUrefHbl
2/Q along Marylebone Road, source York Street
neutral unstable Distance from intersection, mm CUrefHbl
2/Q
Hbl/LMO = -2.7
SLIDE 25
C* = CUHH2/Q independent of Re (U) and Q over range examined C* independent of model scale 1:200 to 1:500 C* repeatability (multi-user) better than ±10% Effect of shallow boundary layer on C*(x,y,0) ~ -25% (not shown) Effect of model detail on C* ≤ +30% Effect of upwind detail on C* < ±25% Effect of slightly unstable approach flow on C* ~ - 30% … but C* ~ 12(R/H)-2 robust
Sensitivity studies