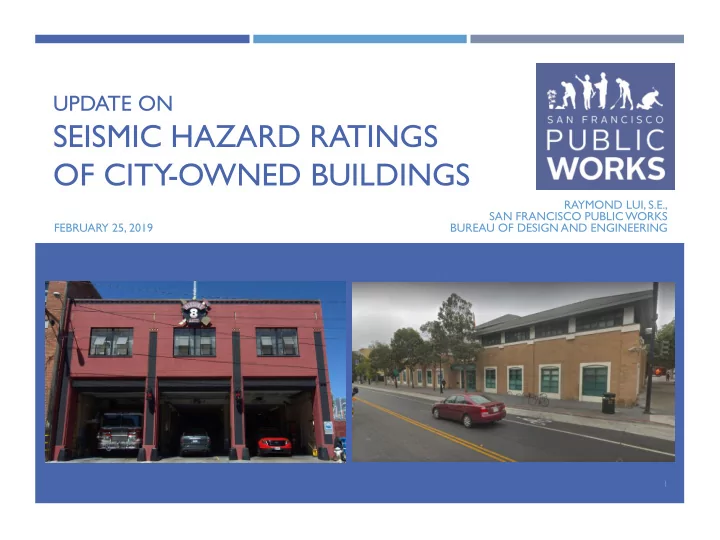

UPDATE ON SEISMIC HAZARD RATINGS OF CITY -OWNED BUILDINGS RAYMOND LUI, S.E., SAN FRANCISCO PUBLIC WORKS FEBRUARY 25, 2019 BUREAU OF DESIGN AND ENGINEERING 1
HAZUS HAZUS is a nationally-applicable methodology developed by FEMA to estimate potential losses from earthquakes, hurricanes, and floods Input: Soil maps, ground shaking maps, building inventory maps, building structural data, building occupancy data, building economic data Output: Estimated economic impact, building damage, and casualties It is a relative risk model, and helps prioritize mitigation efforts, emergency preparedness, and response and recovery planning MITIGATION MITIGATION MITIGATION • Prioritize seismic retrofits of • Prioritize seismic retrofits of • Prioritize seismic retrofits of existing facilities existing facilities existing facilities • Support development of local • Support development of local • Support development of local hazard mitigation plans hazard mitigation plans hazard mitigation plans • Support development of • Support development of • Support development of hazard-resistant building hazard-resistant building hazard-resistant building codes & land use planning codes & land use planning codes & land use planning activities activities activities 2
HAZUS City-owned Portfolio ANALYSIS Hazus Analysis: High-Priority Buildings SHR SHR SHR Bond Programs PROGRAMS CAPITAL Other Sources B.O.R.P Program 3
HAZUS PROJECTED BUILDING DAMAGE (2017) Hayward San Andreas San Andreas San Andreas M6.9 M6.5 M7.2 M7.9 195 183 127 75 Green-tagged 32 44 89 74 Yellow-tagged 12 12 23 90 Red-tagged Total Buildings 239 239 239 239 4
HAZUS PROJECTED ECONOMIC IMPACT (LOSSES IN 2017) Hayward San Andreas San Andreas San Andreas $ in millions M6.9 M6.5 M7.2 M7.9 107.2 133.4 212.3 353.1 Structural Damage 398.3 545.4 859.7 1,489.3 Non-Structural Damage 505.5 678.8 1,072.0 1,842.4 Total Building Damage Content Damage 130.1 426.7 523.6 714.3 Operational Losses; Rent, 154.8 191.9 314.7 527.2 Relocation & Lost Income 790.4 1,297.3 1,910.3 3,083.8 Total Economic Impact 5
SEISMIC EVALUATION CRITERIA ASCE 41-13: Seismic Evaluation and Retrofit of Existing Buildings BSE-1E: 20% probability of exceedance in 50 years (225 year return period) BSE-2E: 5% probability of exceedance in 50 years (975 year return period) SHR Evaluations 10% probability of exceedance in 50 years (475 year return period) 6
SEISMIC HAZARD RATING ASCE 41 Structural Performance Level at SHR SHR Description BSE-1N Negligible damage (very good performance). Minimal to no disruption to the building’s function. Damage is so Immediate Occupancy minor or negligible, that repair is not necessary. (I.O.) Minor damage (good performance). Some structural or nonstructural damage and/or falling hazards may occur, 1 but these would pose minimal life safety hazards to occupants. The damage can be repaired while the building is occupied and with minimum disruption to functions. Buildings and structures with this rating represent an acceptable level of earthquake safety, and funds need not be spent to improve their seismic resistance to gain greater life safety. Damage Control Moderate damage (fair performance). Structural and nonstructural damage and/or falling hazards are anticipated which would pose low life hazards to occupants. The damage can be repaired while the building is occupied. 2 Buildings and structures with this rating will be given a low priority for expenditures to improve seismic performance and/or falling hazards to the “good performance” level. Life Safety Major damage (poor performance). Structural and nonstructural damage are anticipated which would pose (L.S.) appreciable life hazards to occupants. The building has to be vacated during repairs, or possibly cannot be repaired 3 due to the extent and/or economic considerations. Buildings and structures with this rating will be given a high Limited Safety priority for expenditures to improve seismic performance and/or falling hazards to the “good performance” level, or would be considered for other abatement programs such as reduction of occupancy. Collapse Prevention Partial/total collapse (very poor performance). Extensive structural and nonstructural damage, potential (C.P.) structural collapse and/or falling hazards are anticipated which would pose high life safety hazards to occupants. There is a high likelihood that damage repairs would not be feasible. Buildings and structures with this rating will 4 be given the highest priority for expenditures to improve seismic performance and/or falling hazards to the “good performance” level, or would be considered for other abatement programs such as reduction of occupancy or vacation. 7
COMPLETED SHR’S FOR OVER 50 BUILDINGS Animal Care and Control Fire Public Health Police Public Works Real Estate Recreation and Parks 8
SHR FOR SELECTED CITY-OWNED BUILDINGS 9
PRIORITY SEISMIC RISK FACILITIES & THE CAPITAL PLAN Buildings SHR Mitigation Plan 4 Planned – Relocate staff SFGH Building 10/20 101 Grove 4 Planned – Relocate staff 4 Planned – Retrofit Maxine Hall 4 Planned – Relocate staff 170 Otis 4 ESER Priority Fire Stations 2, 6, 7, 40 4 Ingleside, Taraval PD Stations ESER Priority McLaren Lodge 4 TBD 260 Golden Gate, 525 5 th Street, 1001 Polk 4 Newly assessed, TBD 10
HAZUS PROJECTED ECONOMIC IMPACT (LOSSES IN 2017) Hayward San Andreas San Andreas San Andreas $ in millions M6.9 M6.5 M7.2 M7.9 107.2 133.4 212.3 353.1 Structural Damage 398.3 545.4 859.7 1,489.3 Non-Structural Damage 505.5 678.8 1,072.0 1,842.4 Total Building Damage Content Damage 130.1 426.7 523.6 714.3 Operational Losses; Rent, 154.8 191.9 314.7 527.2 Relocation & Lost Income 790.4 1,297.3 1,910.3 3,083.8 Total Economic Impact 11
RISKS OF NONSTRUCTURAL EARTHQUAKE DAMAGE Completed pilot project to determine nonstructural performance Maxine Hall Health Center Mission Police Station ASCE 41-17: Seismic Evaluation and Retrofit of Existing Buildings FEMA E-74: Reducing the Risks of Nonstructural Earthquake Damage Photo from FEMA E-74 12
RISKS OF NONSTRUCTURAL EARTHQUAKE DAMAGE Nonstructural Components Architectural Mechanical and Electrical Equipment Furnishings and Interior Equipment Mitigation to Reduce Recovery Costs and Downtime Photo from FEMA E-74 13
QUESTIONS Photo from oshpd. ca.gov 14
Recommend
More recommend