Search for Frame- -Dragging Dragging- -Like Signals in the - - PowerPoint PPT Presentation

search for frame dragging dragging like signals in the
SMART_READER_LITE
LIVE PREVIEW

Search for Frame- -Dragging Dragging- -Like Signals in the - - PowerPoint PPT Presentation

Search for Frame- -Dragging Dragging- -Like Signals in the Vicinity of Like Signals in the Vicinity of Search for Frame Spinning Superconductors Spinning Superconductors M. Tajmar M. Tajmar Space Propulsion & Advanced Advanced


slide-1
SLIDE 1

Search for Frame Search for Frame-

  • Dragging

Dragging-

  • Like Signals in the Vicinity of

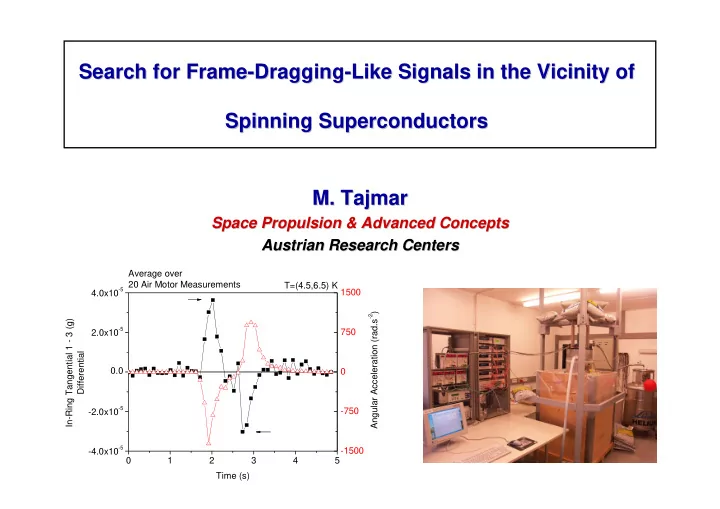
Like Signals in the Vicinity of Spinning Superconductors Spinning Superconductors

  • M. Tajmar
  • M. Tajmar

Space Propulsion & Space Propulsion & Advanced Advanced Concepts Concepts Austrian Austrian Research Centers Research Centers

1 2 3 4 5

  • 4.0x10
  • 5
  • 2.0x10
  • 5

0.0 2.0x10

  • 5

4.0x10

  • 5
  • 1500
  • 750

750 1500 T=(4.5,6.5) K Average over 20 Air Motor Measurements Angular Acceleration (rad.s

  • 2)

In-Ring Tangential 1 - 3 (g) Differential Time (s)

slide-2
SLIDE 2

The The Classical Classical Picture of Picture of Gravity Gravity Important Important Aspect Aspect of GRT:

  • f GRT: FRAME DRAGGING

FRAME DRAGGING

  • Very small effect in vicinity of massive spinning objects
  • Evidence from Gravity Probe-B, LAGEOS and other observations
  • Impossible to generate frame-dragging in an Earth laboratory - we

would need a "Neutron-Star in the Lab"

Does Does it it make make a a difference difference if if the the test test mass mass is is superconducting superconducting ? ?

slide-3
SLIDE 3

London Moment London Moment ω v v ⋅ − = e m B 2 London Moment London Moment rot

* * *

= + × ∇ = B q v m p 0.999992 2

Pair Cooper

=

− e

m m

Theoretical Prediction

1) 1.000084(2 2

Pair Cooper

=

− e

m m

Precision Measurement

Unfortunately, the reason for the discrepancy between the experiment and all theories remains unclear.

Jiang, Y., Liu, M., Physical Review B, 63, 2001, 184506

Tate et al, PRL, 62(8), 845 (1989)

slide-4
SLIDE 4

Gravitomagetic Gravitomagetic Correction Correction Proposal Proposal

Gravitomagnetic Gravitomagnetic Field Field Necessary Necessary to to Solve Solve Anomaly Anomaly in Nb in Nb Superconductor Superconductor at T=5K at T=5K

ω ω ω v v v v ⋅ × = Δ = ⎟ ⎟ ⎠ ⎞ ⎜ ⎜ ⎝ ⎛ − ⋅ =

−4 *

10 84 . 1 2 2 m m m m m Bg

Tajmar, M., de Matos, C.J., "Gravitomagnetic Field of a Rotating Superconductor and

  • f a Rotating Superfluid", Physica C, 385(4), 2003, pp. 551-554

ω

g

B B rot

* * * *

= + + × ∇ =

g

B m B q v m p

*

m

… measured Cooper-Pair Mass

m

… theoretical Cooper-Pair Mass

No No classical classical explanation explanation

slide-5
SLIDE 5

Experimental Design Experimental Design

slide-6
SLIDE 6

Experimental Concept Experimental Concept

Use of Gyroscopes and Accelerometers to Detect Frame-Dragging-Like and Gravitational-Like Fields Induced From Angular Velocity and Acceleration of Spinning Superconductors

Fiber Fiber-

  • Optic

Optic Gyroscope Gyroscope (KVH DSP (KVH DSP-

  • 3000)

3000) MEMS MEMS Accelerometer Accelerometer ( (Colibrys Colibrys SF1500) SF1500) Noise: 300 ng.Hz-0.5 Noise: 2.10-5 rad.s-1.Hz-0.5

slide-7
SLIDE 7
slide-8
SLIDE 8

Experimental Setup Experimental Setup

Accelerometer Setup (Example) Accelerometer Setup (Example) Gyroscope Setup (Example) Gyroscope Setup (Example)

Hall Sensor Hall Sensor

slide-9
SLIDE 9

Cryostat Assembly Cryostat Assembly

Sensor Chamber Mounted on Separate Heavy Structure Ensures Mechanical De-Coupling

slide-10
SLIDE 10

Accelerometer Accelerometer Measurements Measurements

slide-11
SLIDE 11

Sensor Sensor – – Vacuum Chamber Vacuum Chamber

  • Colibrys SF1500 accelerometers mounted on all

positions

  • Hall sensor for magnetic fields
  • Kapton heaters and PT-100 resistors for

temperature control

  • MLI insulation installed
  • Vacuum chamber evacuated and leak checked

Accelerometer Sensor Accelerometer Sensor Flange Flange Sensor Vacuum Chamber Sensor Vacuum Chamber Superconductor glued in STYCAST Superconductor glued in STYCAST Epoxy and Epoxy and Si Si-

  • Diode for

Diode for Temperature Measurement Temperature Measurement

slide-12
SLIDE 12

Accelerometer Facility Accelerometer Facility

  • More than one year of calibration including three major facility adjustments

(lessons learned)

  • Special low-temperature bearing (MoS2 coating) and magnetic bearing
  • Evaluation of influence due to EM fields, ground noise, acoustic noise, ...
  • Two different accelerometers used (Silicon Design and Colibrys)
  • Influence of field coil and trapped magnetic fields
  • Determination of exact transition temperature using Meissner-Ochsenfeld

Effect and Hall Sensor

  • Radiation shields and heat conductivity improvements
  • Active thermal management on sensors

The most important problem was to The most important problem was to hold the low temperature during operation hold the low temperature during operation. At the . At the end the change in temperature during rotation was < 1K. end the change in temperature during rotation was < 1K. Additional problems were arising due to the Additional problems were arising due to the strong expansion of helium gas from the strong expansion of helium gas from the liquid phase liquid phase. .

slide-13
SLIDE 13

Accelerometer Setup Accelerometer Setup – – Error Error Sources Sources

  • Air motor for low E/M noise
  • Magnetic field influence negligible

(5x10⁻⁴ g/T)

  • Dominant error source: vibration

rectification from acoustic noise

10 15 20 25 30 35 40 45 50 0.0538 0.0540 0.0542 0.0544 0.0546 0.0548

  • 1000
  • 800
  • 600
  • 400
  • 200

200 400 600 800 1000

Angular Speed [rad.s

  • 1]

In-Ring Radial Acceleration [g] Time [s]

slide-14
SLIDE 14

Niobium Measurements Niobium Measurements

2 4 6 8 10 12 14 16

  • 0.0002
  • 0.0001

0.0000 0.0001 0.0002

  • 2000
  • 1500
  • 1000
  • 500

500 1000 1500 2000 Angular Acceleration (rad.s

  • 2)

In-Ring Tangential (g) Differential Time (s)

First Sign of a Induced First Sign of a Induced Acceleration Fields! Acceleration Fields!

Temperature Range: 4 Temperature Range: 4 – – 6 K 6 K

  • Factor 3

Factor 3-

  • 4 above Noise Level

4 above Noise Level

  • Difference seen in Alternating Profiles

Difference seen in Alternating Profiles

  • About one order of magnitude higher than

About one order of magnitude higher than theoretical prediction theoretical prediction

  • Result can not explain Tate’s Cooper

Result can not explain Tate’s Cooper-

  • Pair

Pair Mass Anomaly Mass Anomaly – – but it is a contribution but it is a contribution

slide-15
SLIDE 15

1 2 3 4 5

  • 4.0x10
  • 5
  • 2.0x10
  • 5

0.0 2.0x10

  • 5

4.0x10

  • 5
  • 1500
  • 750

750 1500 T=(10,14) K Average over 88 Air Motor Measurements Angular Acceleration (rad.s

  • 2)

In-Ring Tangential 1 - 3 (g) Differential Time (s)

Niobium Curl Measurements Niobium Curl Measurements

Superconducting Superconducting Non Non-

  • Superconducting

Superconducting

1 2 3 4 5

  • 2.0x10
  • 5
  • 1.0x10
  • 5

0.0 1.0x10

  • 5

2.0x10

  • 5
  • 1800
  • 900

900 1800 Angular Acceleration (rad.s

  • 2)

Above-Ring Curl Acceleration Field (g) Differential Time (s) 1 2 3 4 5

  • 4.0x10
  • 5
  • 2.0x10
  • 5

0.0 2.0x10

  • 5

4.0x10

  • 5
  • 1500
  • 750

750 1500 T=(4.5,6.5) K Average over 20 Air Motor Measurements Angular Acceleration (rad.s

  • 2)

In-Ring Tangential 1 - 3 (g) Differential Time (s)

  • 6.06 ± 1×10⁻⁹

Above-Ring (SC)

  • 1.24 ± 1×10⁻⁹

In-Ring (Non-SC)

  • 2.26 ± 0.3×10⁻⁸

In-Ring (SC) Coupling Factor [g.rad-1.s2] Sensor

slide-16
SLIDE 16

Vibration Vibration Artifact Artifact or Real

  • r Real Effect

Effect ? ?

4 6 8 10 12 14

  • 2.50E-008
  • 2.00E-008
  • 1.50E-008
  • 1.00E-008
  • 5.00E-009

0.00E+000 5.00E-009

In-Ring Coupling Factor [s

2]

Temperature [K] Experiment Cooper-Pair Theoretical Prediction

Niobium Curl Measurements Niobium Curl Measurements

x2

slide-17
SLIDE 17

Laser Laser Gyroscope Gyroscope Measurements Measurements

slide-18
SLIDE 18

Gyroscope Facility Gyroscope Facility

  • Gyroscope is vibration insensitive (manufacturer quote)
  • Optical measurement (Sagnac, Doppler effects)
  • Very sensitive monitoring of the magnetic environment using Honeywell

magnetoresistive sensor (HMC 1001) with 0.1 nT resolution

  • Weak influence of motor magnetic field found (Faraday effect on laser

beam) – additional shielding with µ-Metal ⇒ 0.04 rad/s/T

  • Same superconductor, etc. used as in accelerometer configuration

Ring Laser Gyroscope (RLG) Ring Laser Gyroscope (RLG) Fiber Optic Gyroscope (FOG) Fiber Optic Gyroscope (FOG)

slide-19
SLIDE 19

Gyroscope Setup Gyroscope Setup

Reference Reference Middle Middle Above Above Al Al YBCO YBCO Magnetic Magnetic Field Field Sensors Sensors Al or Al or Nb Nb Stainless Steel Stainless Steel

slide-20
SLIDE 20

Gyro Measurements @ 4 Gyro Measurements @ 4-

  • 6 K

6 K

YBCO, LG 3 YBCO, LG 3-

  • 4

4

5 10 15 20 25

  • 2.5x10
  • 5
  • 2.0x10
  • 5
  • 1.5x10
  • 5
  • 1.0x10
  • 5
  • 5.0x10
  • 6

0.0 5.0x10

  • 6

1.0x10

  • 5

1.5x10

  • 5

2.0x10

  • 5

2.5x10

  • 5
  • 450
  • 225

225 450

Angular Velocity [rad.s

  • 1]

Gyro Output [rad.s

  • 1]

Time [s]

Signal can be seen Signal can be seen – – but there is a but there is a parity violation parity violation ! !

slide-21
SLIDE 21

Gyro Measurements @ 4 Gyro Measurements @ 4-

  • 6 K

6 K

Parity Violation is independent of Gyro Orientation Parity Violation is independent of Gyro Orientation

5 10 15 20 25

  • 3.0x10
  • 5
  • 2.0x10
  • 5
  • 1.0x10
  • 5

0.0 1.0x10

  • 5

2.0x10

  • 5

3.0x10

  • 5
  • 450
  • 225

225 450

Gyro Output [rad.s

  • 1]

Time [s]

Angular Velocity [rad.s

  • 1]

5 10 15 20 25

  • 3.0x10
  • 5
  • 2.0x10
  • 5
  • 1.0x10
  • 5

0.0 1.0x10

  • 5

2.0x10

  • 5

3.0x10

  • 5
  • 450
  • 225

225 450

Angular Velocity [rad.s

  • 1]

Gyro Output [rad.s

  • 1]

Time [s]

slide-22
SLIDE 22

5 10 15 20 25

  • 3.0x10
  • 5
  • 2.0x10
  • 5
  • 1.0x10
  • 5

0.0 1.0x10

  • 5

2.0x10

  • 5

3.0x10

  • 5
  • 450
  • 225

225 450

Angular Velocity [rad.s

  • 1]

Gyro Output [rad.s

  • 1]

Time [s] Niobium Aluminium YBCO

5 10 15 20 25

  • 3.0x10
  • 5
  • 2.0x10
  • 5
  • 1.0x10
  • 5

0.0 1.0x10

  • 5

2.0x10

  • 5

3.0x10

  • 5
  • 450
  • 225

225 450

Angular Velocity [rad.s

  • 1]

Gyro Output [rad.s

  • 1]

Time [s] No Sample

5 10 15 20 25

  • 3.0x10
  • 5
  • 2.0x10
  • 5
  • 1.0x10
  • 5

0.0 1.0x10

  • 5

2.0x10

  • 5

3.0x10

  • 5
  • 450
  • 225

225 450

Angular Velocity [rad.s

  • 1]

Gyro Output [rad.s

  • 1]

Time [s] Niobium Aluminium YBCO

Gyro Measurements @ 4 Gyro Measurements @ 4-

  • 6 K

6 K

LG 1 (Ref) LG 1 (Ref) LG 3 LG 3-

  • 4 (Above)

4 (Above) LG 3 LG 3-

  • 4 (Above)

4 (Above) – – No Sample No Sample

5 10 15 20 25 30 35 40 45 50

  • 1.50E-008

0.00E+000 1.50E-008 3.00E-008 4.50E-008 6.00E-008

Coupling Factor Temperature [K]

Niobium Aluminum YBCO

slide-23
SLIDE 23

Gyroscope Facility Gyroscope Facility

1. The signals are real – we have detected a frame-dragging-like signal Bg/ω ≅ 3-5×10⁻⁸, parity violation, no superconducting effect 2. Facility effect: the reference signal must be subtracted (chamber movement) Bg/ω ≅ 1.3×10⁻⁸, parity violation ?, superconducting effect ? 3. Facility effect: aluminum is the reference and must be subtracted Bg/ω ≅ 1.6-2.2×10⁻⁸, parity violation ?, superconducting effect 4. All signals are false due to facility artifacts: Possible Interpretation of Measurements Possible Interpretation of Measurements

  • Magnetic field influence ⇒ Bg/ω = 4×10-11
  • Tilting of sensors
  • Mechanical friction
  • Pressure effect
  • Vibration offsets
slide-24
SLIDE 24

Facility Effects Facility Effects

Tilting of Sensors

( ) ( ) [ ]

α Δ + − ⋅ = latitude sin latitude sin µrad 73 Offset

An angle of 20 degreed would be necessary An angle of 20 degreed would be necessary to explain results. That is impossible! to explain results. That is impossible!

Mechanical Friction

  • Can not explain only one preferred direction
  • Viscosity of helium @ 5K is one order of magnitude lower

than air @ 300K where no effect is seen

mN x Av FStokes 1 = ≅η rad 10 5

8 −

× = φ

Bg/ω = 3×10-11

Experiment shows Experiment shows B Bg

g/

/ω ω = = 10 10-

  • 8

8 rad

rad ! !

slide-25
SLIDE 25

Facility Effects Facility Effects

Pressure Effect

  • Initial pressure after

LHe fill up is 100 mbar. All succeeding profiles are < 3mbar

  • Effect of pressure

increase was simulated using compressed air

5 10 15 20 25

  • 2.0x10
  • 5
  • 1.5x10
  • 5
  • 1.0x10
  • 5
  • 5.0x10
  • 6

0.0 5.0x10

  • 6

1.0x10

  • 5

1.5x10

  • 5

2.0x10

  • 5

0.00 0.02 0.04 0.06 0.08 0.10 0.12

Pressure [bar] Gyroscope Output [rad.s

  • 1]

Time [s]

No facility effect has been found up to know that can explain th No facility effect has been found up to know that can explain the e results obtained! Measurements are repeatable and appear genuine results obtained! Measurements are repeatable and appear genuine. .

Vibration Effect

5 10 15 20 25 30

  • 1.6x10
  • 4
  • 1.2x10
  • 4
  • 8.0x10
  • 5
  • 4.0x10
  • 5

0.0 4.0x10

  • 5

8.0x10

  • 5

1.2x10

  • 4

1.6x10

  • 4

Gyro Output [rad.s

  • 1]

Time [s] Direction Z+ Direction Z- Vibration On

  • Gyros react on vibration, but only in Z+ and X+

direction – effect does not depend on Z orientation

  • No offset present when amplitude is low and signal

noise is kept constant – like during experiment

slide-26
SLIDE 26

Independent Independent Measurements Measurements

slide-27
SLIDE 27

Canterbury Ring Laser Results Canterbury Ring Laser Results

Replication Attempt at World’s Replication Attempt at World’s Largest Ring Laser Gyro Largest Ring Laser Gyro Canterbury Ring Laser Group Canterbury Ring Laser Group

  • Rotation of superconducting lead disc in vicinity of large ring laser beam

line

  • Far field measurement vs. near field measurement (ARC) requires field

expansion assumption

  • Dipolar expansion used for first approximation
slide-28
SLIDE 28
  • Gyro reaction in Counter-Clockwise Rotation (Southern Hemisphere) – correction

to Earth’s rotation ?

  • Disc vs. ring and dipolar assumption can explain over-estimation of Canterbury’s

result

  • More runs are needed to gain in statistics

200 400 600 800 1000 1200 1400 1600 1800

  • 6.0x10
  • 5
  • 3.0x10
  • 5

0.0 3.0x10

  • 5

6.0x10

  • 5
  • 100
  • 50

50 100

Angular Velocity [rad.s

  • 1]

Extrapolated UG2 Gyro Output [rad.s

  • 1]

Time [s]

  • 100
  • 80
  • 60
  • 40
  • 20

20 40 60 80 100

  • 6.0x10
  • 5
  • 3.0x10
  • 5

0.0 3.0x10

  • 5

6.0x10

  • 5

Extrapolated UG2 Gyro Output [rad.s

  • 1]

Angular Velocity [rad.s

  • 1]

Bg/ω=3-5×10-8 Bg/ω=3×10-7 ARC CW Result Canterbury CCW Result

Canterbury Ring Laser Results Canterbury Ring Laser Results

slide-29
SLIDE 29

Gravity Probe B Results Gravity Probe B Results

  • Two pairs or spinning gyros at

cryogenic temperatures as test-bed for

  • ur effect
  • Measurement of GP-B so far

– Geodetic effect – GR Frame-dragging (preliminary) – Polhode motion of gyro rotor – Large anomalous torque detected – presently modeled as patch effect (electrostatic) ?

slide-30
SLIDE 30

Gravity Probe B Results Gravity Probe B Results

Gyro Pair Gyro Pair Guiding Star Guiding Star

Spin Spin-

  • Spin Interaction causes Precession in case

Spin Interaction causes Precession in case

  • f Misalignment with Axis
  • f Misalignment with Axis

( )

ψ sin 2 ⋅ = Ω

g

B

0.0 0.2 0.4 0.6 0.8 1.0 1.2 0.0 0.5 1.0 1.5 2.0 2.5 3.0 3.5 4.0

Gyro 1 Gyro 2 Gyro 3 Gyro 4 Spin-Spin Approximation

Drift Rate [arcsec/day] Angle of Misalignment [deg]

Dipolar Field Approximation & Dipolar Field Approximation & Nb Nb Data Data Ω Ω ≅ ≅ 1.27 1.27 arcsec arcsec/day/deg /day/deg GP GP-

  • B Result:

B Result: 0.35 0.35 – – 2.5 2.5 arcsec arcsec/day/deg /day/deg

  • Alternative explanation and/or contribution

to patch effect

  • Detailed GP-B data needed for further

analysis

  • GP-B data supports our effect !
slide-31
SLIDE 31

Conclusions Conclusions

slide-32
SLIDE 32

Conclusion Conclusion

  • The rotation of an aluminum/stainless steel sample holder with

Al/Nb/YBCO can be “seen” at temperatures below 16-32 K using a FOG

  • A strong asymmetry (CW vs CCW) was found in the signals
  • The coupling factors are about 1-5×10⁻⁸, YBCO produced strongest signal
  • The field expansion is not clear at the moment
  • Canterbury Ring Laser and GP-B see similar effects
  • Facility effects have been investigated and no classical explanation can be

found so far (still vibration effects are under investigation) More gyro data is necessary to finally settle the ground More gyro data is necessary to finally settle the ground: :

  • Increase stiffness of laser gyroscope structure
  • Re-run experiment with laser gyro and accelerometer

together (digital)

  • Comparison with different laser gyro (preliminary data

with Honeywell GG1320)

slide-33
SLIDE 33

Thank Thank you you ! !

and and keep keep fingers fingers crossed crossed …! …!

1 2 3 4 5

  • 8.0x10
  • 5
  • 6.0x10
  • 5
  • 4.0x10
  • 5
  • 2.0x10
  • 5

0.0 2.0x10

  • 5

4.0x10

  • 5

6.0x10

  • 5

8.0x10

  • 5
  • 3000
  • 2250
  • 1500
  • 750

750 1500 2250 3000 T=(4.5,6.5) K Average over 20 Air Motor Measurements Angular Acceleration [rad.s

  • 2]

In-Ring Tangential 1 - 3 [g] Differential Time [s]