Scores ScoresHow we measure success or learning Observed What you - - PDF document

scores scores how we measure success or learning
SMART_READER_LITE
LIVE PREVIEW

Scores ScoresHow we measure success or learning Observed What you - - PDF document

14/09/2016 Prof Gavin T L Brown Quantitative Data Analysis & Research Unit gt.brown@auckland.ac.nz Scores ScoresHow we measure success or learning Observed What you actually get on a test True What you should get if test


slide-1
SLIDE 1

14/09/2016 1 Prof Gavin T L Brown Quantitative Data Analysis & Research Unit gt.brown@auckland.ac.nz

 Scores

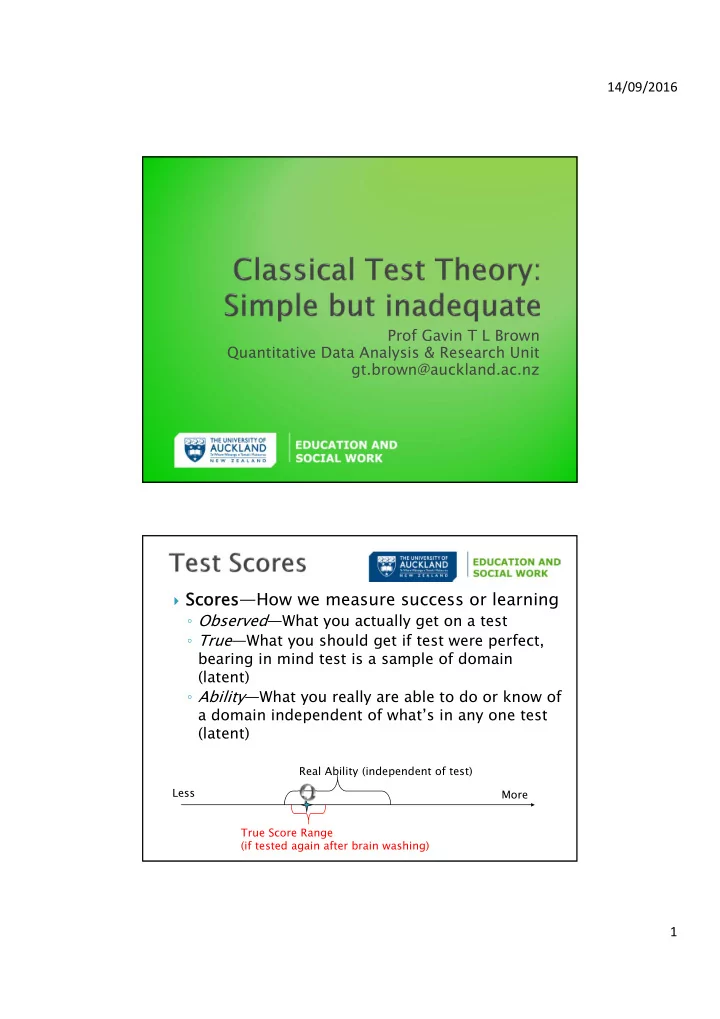
Scores—How we measure success or learning

  • Observed—What you actually get on a test
  • True—What you should get if test were perfect,

bearing in mind test is a sample of domain (latent)

  • Ability—What you really are able to do or know of

a domain independent of what’s in any one test (latent)

Real Ability (independent of test) True Score Range (if tested again after brain washing) Less More

slide-2
SLIDE 2

14/09/2016 2

 Observed score =

TRUE score + ERROR

  • O = T + e

 Total Score is simply

sum of number of items answered correctly

 All items are equivalent

  • Like another brick in the

wall

TEST

ite m ite m ite m ite m ite m ite m ite m ite m

 items only mean something in context of the

test they’re in

 All items are random sample of domain

being tested

 All items have equal weight in making up

test statistics

 Error is assumed to be random

  • If not random, then X the measurement is Biased

Biased

  • O=T+e

O=T+erando

random+e

+esystematic

systematic

  • Accept random but try to minimise it
  • but remove systematic
slide-3
SLIDE 3

14/09/2016 3

 Random error means that

  • Errors will sometimes be positive, sometimes

negative

 tend to cancel out when we add up a person’s score

  • Errors will not be correlated with other things

 e = 0  Thus, test score correlations depend on the true components – not error  E(X) = T

  • Thus the higher the proportion of t in X the

higher the correlations will be between items

 The more items correlate with each other the less disturbance

slide-4
SLIDE 4

14/09/2016 4

 Core total test statistics are:

  • DIFF

DIFFICUL ULTY TY: the average test score (mean) DISCRIM DISCRIMINATION NATION: Who gets the items correct? The spread of scores (standard deviation)

  • RELIABILI

RELIABILITY: how small is the error?

 All statistics for persons and items are sample

dependent

  • Requires robust representative sampling

(expensive, time consuming, difficult)

  • Classrooms are not large or representative;

schools might be

slide-5
SLIDE 5

14/09/2016 5

 Not about the complexity or obscurity of the item  Nor does it relate to an individual’s subjective reaction  Derived from the responses to an item  Item Difficulty: % answer correct or wrong

  • How hard is the item?
  • Mean correct across people is p
  • Usually delete items too easy (p>.9) or too

hard (p<.1) for generalised ability test

 Don’t want all items to have

a p = .50

 Need to spread items out to

measure the full range of the trait

 Accuracy in score

determination requires enough information for each person’s ability

Where are the easy items?

slide-6
SLIDE 6

14/09/2016 6

 Who gets the item right?

  • Correlation between item and total score, person

by person – expect best students to get items correct, and least able to get it wrong

  • Are the distractors working properly?
  • Look for values > .20
  • Beware negative or zero discrimination items

 Almost

everyone chooses the wrong answer

slide-7
SLIDE 7

14/09/2016 7

 Item to total correlations  Point-biserial – dichotomous and continuous

variable

  • The correlation of the item to the total without the item in

the total

item total 1 1 1 1 2 3 4 1 5 6 7 8 9 10

y = -0.1091x + 0.9091 R² = 0.5143 1 2 4 6 8 10 Item Item score score To Total sc score

Ne Negati gative ite ve item correl correlati tion

total Linear (total)

What does it mean if low scoring students do better on an item than high scoring students?

slide-8
SLIDE 8

14/09/2016 8

 Selecting items with high item to total correlations

will maximize internal consistency reliability

  • Items that correlate with total score also tend to correlate

with other items

 Problem: items with extreme p values have low

variance, which will depress item discrimination

  • p<.10 or p>.90 will reduce discrimination and reliability

 Reliability Agreement Processes

  • Time to Time comparison (test-retest)
  • Assessment to Assessment comparison

(e.g., test to observation to portfolio) sometimes known as construct validity

  • Marker to Marker comparison (inter-rater)
  • Items to Total Score comparison (internal

estimate, assuming e is random)

 Can & SHOULD be measured

slide-9
SLIDE 9

14/09/2016 9

 Split-half procedure

  • Test divided into halves either

 Separately administered  Divided after single overall measurement

  • Often odd versus even items to make split-halves
  • Since N is reduced when test is halved correlation

has to be adjusted

  • Spearman-Brown formula:

 R = R = 2r r / (1 + / (1 + r) where R = reliability of full test, r is the correlation between the halves  Internal Consistency Method

  • Calculate the correlation of each item with every
  • ther item on the test (Note: Not item-total

correlations)

  • Each item seen as a miniature test with true and

error components

  • Intercorrelations depend only on the true

components

  • Hence reliability can be deduced from

intercorrelations

  • Resulting measure is called Cronbach’s Alpha

 But alpha is always the lowest estimate of reliablity lower bound

slide-10
SLIDE 10

14/09/2016 10

 A measure of the extent to which test scores

would vary if the test were taken again

  • Computed from reliability
  • A persons true scor

true score will be within one standard error of the observed score two out of three times

  • If the person took the test

test again a wider interval would be found as the test score includes error

T EM

r SD s

1

1 

where SD is the standard deviation of the test scores and r1T is the reliability coefficient, both computed from the same group If an IQ test has a standard deviation of 15 and a reliability coefficient of .89, the standard error of measurement of the test would be:

5 ) 33 (. 15 11 . 15 89 . 1 15    

slide-11
SLIDE 11

14/09/2016 11

Student Q1 Q2 Q3 Q4 Q5 Tot. 1 1 1 2 2 1 1 1 3 3 1 1 1 1 4 Diff p .67 .67 .67 .67 .33 Disc r

  • .87

.00 .87 .87 .87

ITEMS ITEMS

All items acceptable difficulty Need many more students to have confidence in measurements Poor items: Q1 (reverse discrimination) Q2 (zero discrimination)

 Indices of difficulty and discrimination are sample

dependent

  • change from sample to sample

 Trait or ability estimates (test scores) are test

dependent

  • change from test to test

 Comparisons require parallel tests or test

equating – not a trivial matter

 Reliability depends on SEM, which is assumed to

be of equal magnitude for all examinees (yet we know examinees differ in ability)