
SLIDE 1
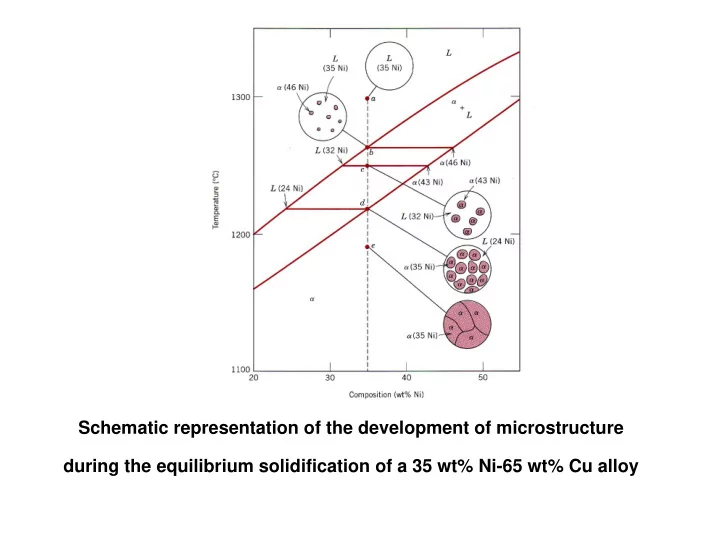
Schematic representation of the development of microstructure during the equilibrium solidification of a 35 wt% Ni-65 wt% Cu alloy
Schematic representation of the development of microstructure during - - PowerPoint PPT Presentation
Schematic representation of the development of microstructure during the equilibrium solidification of a 35 wt% Ni-65 wt% Cu alloy At 1300 C (point a) the alloy is in the liquid condition This continues until the solidification path
Schematic representation of the development of microstructure during the equilibrium solidification of a 35 wt% Ni-65 wt% Cu alloy
liquid condition
(vertical line) crosses the liquidus at about ~ 1260 ºC (point b) where solid α starts to precipitate within the liquid with composition of 46% Ni.
(around ~ 1250 ºC) the amount of α has grown within the liquid while the compositions of both α and the liquid change following the solidus and liquidus lines, respectively.
with its composition following the solidus line at the expense of the liquid.
solidus line) solidification is complete and the structure is composed entirely of solid α with overall composition as the
the composition of α
developments under non-equilibrium conditions.
microstructural developments under equilibrium and non equilibrium conditions as shown below.
In this system the two metals which are completely soluble in the liquid state become only partially soluble in the solid state
The copper-silver phase diagram
binary isomorphous system a few points can be added to the binary eutectic system which also are applicable for other types of binary system:
a single solid solution phase field from a two solid solution phase field) is termed “Solvus”.
which intersects the solidus line and is has a symbol of “E” indicating the point at which the “Eutectic reaction” takes place
phases can co-exist and is termed the “invariant point”. Alloys of the eutectic composition will have the lowest melting point.
phase composition and phase amount still apply.
be used to explain the Eutectic binary system as follows:
state having the original composition of the alloy (40 % Sn)
liquid upon crossing the liquidus line (point k)
l) α phase and liquids co-exist with compositions around 18.3 and 61.9 Sn, respectively.
eutectic temperature, solidification proceeds by a eutectic reaction forming alternate layers of α and β.
liquid phase results in two solid phases:
temperature (the eutectic temperature)
solidification through the eutectic reaction is termed “primary α”.
composed of a mixture of primary α and the eutectic structure.
solidify at a constant temperature (the eutectic temperature) and the microstructure will be completely composed of the eutectic structure (layers
termed eutectic alloys
eutectic composition are termed hypoeutectic alloys
eutectic composition are termed hypereutectic alloys
composition and the amounts of phases in an alloy containing 40% Sn at 150 ºC
under non-equilibrium conditions in
new phases is a solid phase the reaction is termed a “Eutectoid” reaction.
eutectoid alloys
composition are termed hypoeutectoid alloys
composition are termed hypereutectoid alloys
which are already present interact at a fixed temperature to produce an entirely new phase.
the transformation is termed peritectic transformation.
transformation is termed peritectoid transformation.
used to explain the peritectic reaction.
place in alloys containing between 12 % and 69 % silver.
25% silver and 75% platinum
solidification proceeds by precipitating solid α with its composition moving along the solidus line (SP) while the composition of the liquid moving along the liquidus line (SR).
composed of solid α with composition (12% silver and the remaining liquid with composition 69% silver with wt. % as follows:
RP R x W
1
=
α
RP P x WL
1
=
peritectic reaction takes place where the solid α starts to interact with the liquid and producing the new phase “δ”, i.e.,
during the transformation and the final structure will be composed of a mixture of δ and α.
PQ Q x W
1
=
α
PQ P x W
1
=
δ
containing more than 45% silver the solid phase α will be used up before the liquid and the final structure will be composed of a single solid phase δ.
Magnesium-Tin phase diagram
phase field but appear in a two-phase filed as in this example.
actual phase field is a straight vertical line (having a width of zero).
intermediate phase (in this case an intermetallic compound) has the highest melting point due to the additional “chemical” effects on the bonding between the alloying elements.
discussion applies to this binary system.
is that of the iron-carbon, as this represents the phase diagram of all plain carbon steels and cast irons.
actually the iron-iron carbide (Fe-Fe3C) phase diagram
diagram, the important phases present are:
an FCC lattice structure with a maximum solubility of carbon of about 2% at around1150 ºC.
phase (nearly pure iron) with a BCC lattice structure and a maximum solubility
ºC (in some texts 723 ºC).
This is a hard phase with a constant carbon content of 6.67 %.
pertinent to plain carbon steels (i.e. with carbon content up to 2%)
from the austenite region, the final structure will be a result of a eutectoid reaction (γ ⇔ α + Fe3C) and the structure will be composed of alternate layers of ferrite and cementite.
cooling rate (slow cooling will promote course layers). This type of steel is termed “Eutectoid Steel”
0.8 % carbon content from the austenite region, the final structure will be composed of primary ferrite and eutectoid structure (pearlite).
“Hypoutectoid Steel”
than 0.8 % carbon content from the austenite region, the final structure will be composed of primary cementite and eutectoid structure (pearlite).
“Hyperutectoid Steel”
does not exist is termed the “lower critical temperature” this is a fixed temperature and is equal to the eutectoid temperature.
cementite for hypereutectoid steels) does not exist is termed the “upper critical temperature”.
carbon content
content.
carbon content reaching a maximum with a 100% pearlitic steel and then start to decrease.
for various purposes such as improving strength, stress relieving, increasing hardness, toughness, ductility, etc.
be classified as follows:
– Annealing – Normalizing – Hardening – Tempering – Treatments involving isothermal transformations (or continuous cooling) – Case hardening
quite slowly to a predetermined temperature and then cooled.
determines the resulting microstructure and the associated mechanical properties.
to a slow cooling in a furnace.
as follows:
different heat treatment processes applied to metals and alloys and can be classified as follows:
below the lower critical temperature and is applied to cold worked parts in order to relieve stresses set up by mechanical working (cold forming).
the steel to above its recrystallization temperature (500 °C) normally to 650 °C and then allow slow cooling.
increased, prolonged annealing may result in deterioration of properties resulting from the “balling up” of cementite layers within the pearlite resulting in a structure known as “deteriorated pearlite”
heating the steel to a temperature just below the lower critical temperature (between 650 and 700°C ).
cementite within the pearlite.
steels for subsequent hardening.
austenite region (above the upper critical temperature), the grain size tends to increase dramatically driven by the high temperatures.
– As the temperature passes the upper critical temperature, ferrite starts to precipitate along austenite grain boundaries and as cooling continues within the grains along certain crystallographic directions. – As temperature falls to the lower critical temperature, the remaining austenite transform to pearlite.
– This result in islands of strong pearlite separated (or held) by a weak network of soft ferrite. This structure is termed “Widmanstatten structure” characterized by brittleness and weakness. – This structure is heated to a temperature 30 to 40 °C above its upper critical temperature and is held long enough just to allow the part to attain uniform temperature.
– This would result in transformation to austenite, but this time the grain size is small, as the temperature is not too high. – Upon cooling the final structure will be composed of fine ferrite and pearlite a structure with enhanced strength, ductility and toughness.
strength and toughness.
heating cooling is promoted by allowing the part to cool in air.
higher strength levels than those attained in an annealed part.
its austenitic range the normal transformation to pearlite is not possible due to the low temperature and small time allowed for transformation.
austenitic structure due to the fast transformation rates involved in steels.
sufficient carbon produces an extremely hard structure called “martensite”.
as a mass of uniform needle shaped crystals,
more than 0.06 % carbon at room temperature.
distortion.
centered-tetragonal (BCT) one which is between the FCC and BCC.
this increased hardness.
structure known as “Bainite”.
patches, but at higher magnifications of X 1000 appears as laminated structure something like pearlite.
pearlite in that ferrite nucleates first followed by carbide, whereas in pearlite the carbide nucleates first.
the desired cooling rate. The following list is arranged in order of quenching speeds (high to low):
– 5 % caustic soda – 5 – 20 % Brine – Cold water – Warm water – Mineral oil – Animal oil – Vegetable oil
quenched steel parts in order to relieve stresses set up by quenching and reduce brittleness introduced by the extreme hardness values”
critical temperature
temperature reached. Thus the temperature to which a part should be heated must be chosen according to the required properties.
the tempering of martensite containing more than 0.3 % carbon takes place in three stages:
another type of martensite containing only 0.25 % carbon.
(Fe5C2).
and hardness may occur due to the dispersion of fine but hard carbides but brittleness is significantly lowered as quenching stresses disappear in consequence of transformation.
around 200 ºC
transform to Bainite.
due to the replacement of austenite by the much harder Bainite.
cementite and this continues as the temperature rises.
begins to precipitate from the martensite – also as cementite- and in consequence (of freeing carbon) martensite reverts back to its equilibrium form of BCC ferrite.