
Disk Drive Schematic
17
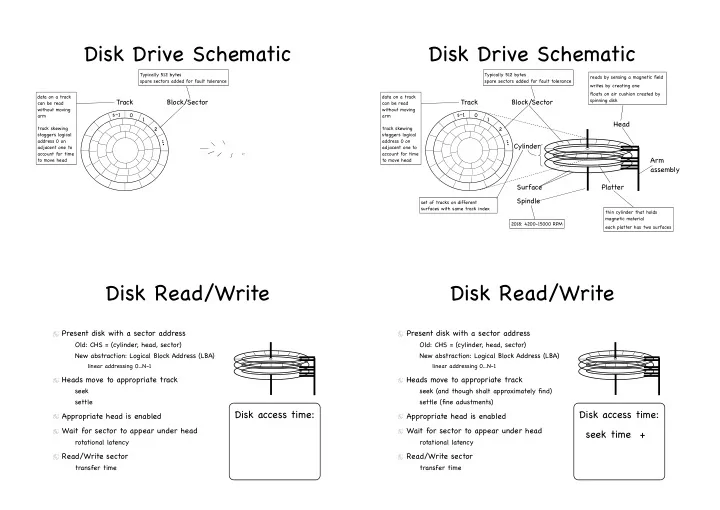
Block/Sector
Typically 512 bytes spare sectors added for fault tolerance
1 2 s–1
... Track
data on a track can be read without moving arm track skewing staggers logical address 0 on adjacent one to account for time to move head
Disk Drive Schematic
18
Block/Sector Platter Surface Head Spindle
thin cylinder that holds magnetic material each platter has two surfaces reads by sensing a magnetic field writes by creating one floats on air cushion created by spinning disk
Arm assembly
Typically 512 bytes spare sectors added for fault tolerance set of tracks on different surfaces with same track index
Cylinder
2018: 4200-15000 RPM
1 2 s–1
... Track
data on a track can be read without moving arm track skewing staggers logical address 0 on adjacent one to account for time to move head
Disk Read/Write
Present disk with a sector address
Old: CHS = (cylinder, head, sector) New abstraction: Logical Block Address (LBA)
linear addressing 0...N-1
Heads move to appropriate track
seek settle
Appropriate head is enabled Wait for sector to appear under head
rotational latency
Read/Write sector
transfer time
Disk access time:
Disk Read/Write
Present disk with a sector address
Old: CHS = (cylinder, head, sector) New abstraction: Logical Block Address (LBA)
linear addressing 0...N-1
Heads move to appropriate track
seek (and though shalt approximately find) settle (fine adustments)
Appropriate head is enabled Wait for sector to appear under head
rotational latency
Read/Write sector
transfer time
Disk access time: seek time +