
SLIDE 1
Sample Score Report by three areas, or claims. Sample - - PowerPoint PPT Presentation
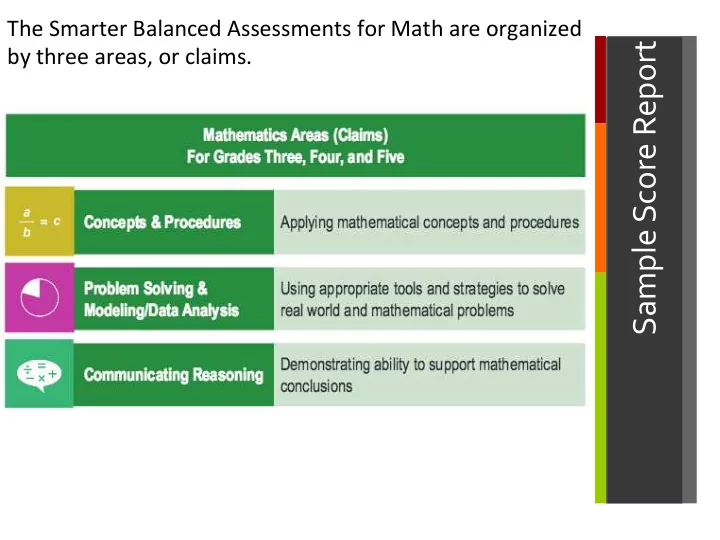
The Smarter Balanced Assessments for Math are organized Sample Score Report by three areas, or claims. Sample Score Report Sample Score Report
Emily’s ¡score ¡of ¡250 ¡is ¡in ¡the ¡Far ¡Below ¡Basic ¡level ¡on ¡California ¡Standards ¡ Test ¡for ¡Science. ¡ ¡ To ¡meet ¡federal ¡test ¡requirements, ¡California ¡administered ¡the ¡California ¡ Standards ¡Test ¡for ¡science ¡to ¡all ¡students ¡in ¡grades ¡5, ¡8, ¡and ¡10. ¡ ¡This ¡test ¡ is ¡not ¡aligned ¡with ¡California’s ¡recently ¡adopted ¡Next ¡Genera9on ¡Science ¡ Standards ¡(NGSS). ¡ ¡Assessments ¡based ¡on ¡these ¡standards ¡are ¡being ¡
The ¡California ¡State ¡University ¡(CSU) ¡and ¡par9cipa9ng ¡California ¡Community ¡Colleges ¡ (CCCs) ¡will ¡use ¡the ¡English ¡language ¡arts/literacy ¡and ¡mathema9cs ¡assessments ¡of ¡the ¡ CAASPP ¡System ¡to ¡determine ¡Emily’s ¡2015 ¡EAP ¡status, ¡which ¡will ¡provide ¡an ¡indicator ¡of ¡ Emily’s ¡predicted ¡readiness ¡to ¡take ¡college-‑level ¡English ¡and ¡mathema9cs ¡courses ¡when ¡ Emily ¡begins ¡college. ¡ ¡ The ¡CAASPP ¡overall ¡score ¡for ¡English ¡language ¡arts/literacy ¡and ¡mathema9cs ¡on ¡the ¡front ¡
level ¡work ¡as ¡described ¡below ¡
Students ¡who ¡are ¡iden9fied ¡at ¡Achievement ¡Level ¡4 ¡in ¡English ¡or ¡mathema9cs ¡will ¡be ¡ classified ¡as ¡ready ¡for ¡college-‑level ¡coursework ¡and ¡will ¡be ¡exempt ¡from ¡taking ¡the ¡CSU ¡ English ¡Placement ¡Test ¡(EPT) ¡or ¡Entry ¡Level ¡Mathema9cs ¡(ELM) ¡exam ¡if ¡they ¡enroll ¡at ¡a ¡CSU ¡
¡ Students ¡who ¡choose ¡at ¡the ¡9me ¡of ¡tes9ng ¡not ¡to ¡release ¡their ¡results, ¡but ¡decide ¡later ¡to ¡ do ¡so, ¡will ¡be ¡required ¡to ¡provide ¡a ¡copy ¡of ¡this ¡CAASPP ¡Student ¡Score ¡Report ¡to ¡the ¡specific ¡ CSU ¡campus ¡or ¡par9cipa9ng ¡CCC. ¡ ¡
Overall'Performance:''1,438&Students&Tested& ' ' '''''85%
$ $ $
$ $ $ $ $
Claim'Performance:''Percent&of&Students&at&Each&Level& &
Performance$$ Summary$14315$
&
ELA'Summative' Grades'3<8,'11'
Met& Achievement& Standard& Not&Met& Achievement& Standard& 1222$Students$ 216$Students$
4$ 3$ 2$ 1$
48%$
690$Students$
37%$
532$Students$
690$ 532$
0$ $$$$$375$ $$$$$$$$$$$$750$
11%$
158$Students$
4%$
58$Students$
158$ $
Re Reading:$Demonstrating$understanding$of$literary$and$non3fiction$texts$
52%$ 42%$ $
Wr Writing:$Producing$clear$and$purposeful$writing$
56%$ 38%$ $
Li Listening:$Demonstrating$effective$communication$skills$
38%$ 57%$ $
Re Research/Inquiry:$Investigating,$analyzing,$and$presenting$
50%$ 45%$ $
Ov Overall$Score$Levels$ $
! 4" $$Exceeded$the$Standards$
$
! 3" $$Met$the$Standard$
$
! 2" $$Nearly$Met$the$Standard$
$
! 1" $$Has$Not$Met$the$Standard$
$
$ Cl Claim$Scor
$
$$$$$$$$$$$ $$$$$$$$$$Above$Standard$
$ $ $$$$$$$$$$$$$$$ $$$$$$$$$$$$$$At$/$Near$Standard$ $ $ $$$$$$$$$$$$$$ $$$$$$$$$$$$$$Below$Standard$
$ $ $
Overall'Performance:''1,428&Students&Tested& ' ' '''''82
$ $ $
$ $ $ $ $
Claim'Performance:''Percent&of&Students&at&Each&Level& &
Performance$$ Summary$14315$
&
Math'Summative' Grades'3<8,'11'
Met& Achievement& Standard& Not&Met& Achievement& Standard& 1171$Students$ 257$Students$
4$ 3$ 2$ 1$
57%$
814$Students$
25%$
357$Students$
814$ 357$
0$ $$$$$375$ $$$$$$$$$$$$750$
13%$
186$Students$
5%$
71$Students$
186$ $
Con Concepts$and$Proc
res:$$Applying$mathematical$concepts$and$procedures$
63%$ 28%$ $
Pr Probl blem em$Solving ng$&$Mo Modeling/Data$Analysis:$Using$appropriate$tools$and$strategies$ to$solve$real$world$mathematical$problems$
61%$ 33%$ $
Com Communicating$Re Reason
57%$ 38%$ $
Ov Overall$Score$Levels$ $
! 4" $$Exceeded$the$Standards$
$
! 3" $$Met$the$Standard$
$
! 2" $$Nearly$Met$the$Standard$
$
! 1" $$Has$Not$Met$the$Standard$
$
$ Cl Claim$Scor
$
$$$$$$$$$$$ $$$$$$$$$$Above$Standard$
$ $ $$$$$$$$$$$$$$$ $$$$$$$$$$$$$$At$/$Near$Standard$ $ $ $$$$$$$$$$$$$$ $$$$$$$$$$$$$$Below$Standard$
$ $ $
The ¡following ¡chart ¡provides ¡overall ¡CAASPP ¡results ¡for ¡Piedmont ¡Unified ¡as ¡ well ¡as ¡other ¡unified ¡school ¡districts ¡that ¡are ¡historically ¡comparable ¡to ¡ Piedmont ¡Unified. ¡ ¡The ¡values ¡indicate ¡the ¡percentage ¡of ¡test-‑takers ¡(grades ¡ 3-‑8, ¡11) ¡who ¡either ¡“met” ¡or ¡“exceeded” ¡the ¡Common ¡Core ¡Standards ¡in ¡ English ¡Language ¡Arts/Literacy ¡and ¡Mathema9cs. ¡
3rd ¡Grade ¡– ¡English ¡Language ¡Arts ¡
3rd ¡Grade ¡– ¡Mathema9cs ¡
7th ¡Grade ¡– ¡English ¡Language ¡Arts ¡
7th ¡Grade ¡– ¡Mathema9cs ¡