
SLIDE 1
Rocketdyne Follow-On Health Study 6-8 April 2005 Overview Who was - - PowerPoint PPT Presentation
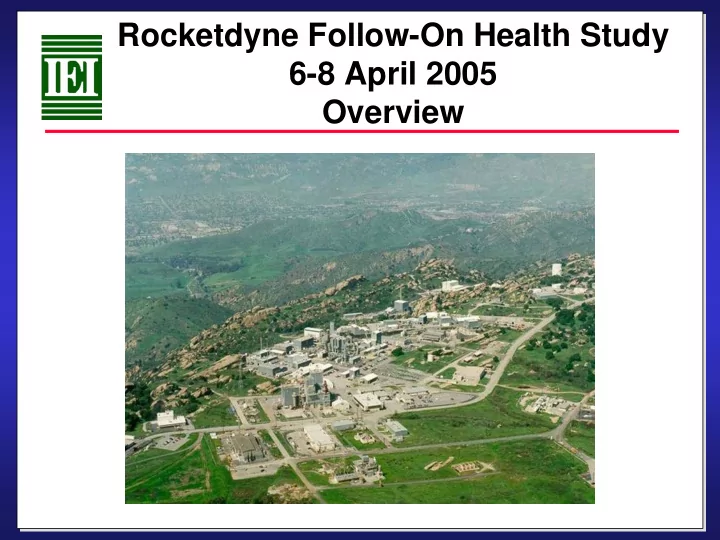
Rocketdyne Follow-On Health Study 6-8 April 2005 Overview Who was in the study? 54,384 Rocketdyne Workers from 1948-1999 6,601 Short Term (< 6 mo.) 46,970 813 Insufficient Eligible Workers Identifying Information or Not Employee
46,970 Eligible Workers 32,979 Comparison Group (Canoga Park etc) 54,384 Rocketdyne Workers from 1948-1999 6,601 Short Term (< 6 mo.) 813 Insufficient Identifying Information or Not Employee 8,372 Chemical Group (SSFL)* 5,801 Radiation Group *
*182 workers included in both groups
*182 workers in the radiation group also worked on test stands
Only External Exposure: 3,569
*182 workers in the radiation group also worked on test stands
Only External Exposure: 3,569
61 124 11,118 7,929 3,189 1,068 126 90 12,816 9,368 3,448 1,098 2,000 4,000 6,000 8,000 10,000 12,000 14,000
All Causes All Non-Cancer Causes All Cancers Lung Cancer Liver Cancer Leukemia Number of Deaths Observed Expected - based on mortality rates for California
1,468 1,012 456 151 18 1,870 1,365 505 169 16 200 400 600 800 1000 1200 1400 1600 1800 2000
All Causes All Non-Cancer Causes All Cancers Lung Cancer Leukemia not CLL
Number of Deaths Observed Expected - based on mortality rates for California
3,803 651 1012 166 100 69 500 1,000 1,500 2,000 2,500 3,000 3,500 4,000
< 5 5-9 10-49 50-99 100-199 ≥ 200
External Radiation Dose (mSv)
1 mSv = 100 mrem
20 40 60 80 100 120 140 160 180 50- 100- > 200
_
Number of Workers
Dose Only at Rocketdyne
Total Dose, including pre- and post-employment at Rocketdyne 1 mSv = 100 mrem
Flat RR – No Association
Dose Comparison Group
Decreasing RR
Dose Comparison Group
Increasing RR - Noteworthy
Comparison Group Dose
0.0 1.0 2.0 3.0 Not Monitored < 5 5-9 10-49 50-99 100-199 ≥ 200
External Radiation Dose (mSv) Relative Risk
2,635 cancers among 41,169 workers 258 cancers among 3,928 workers 54 cancers among 601 workers 93 cancers among 949 workers 8 cancers among 160 workers 13 cancers among 100 workers
10 year lag 1 mSv = 100 mrem
5 cancers among 63 workers
Relative Risk 95% Confidence Limits
0.0 1.0 2.0 3.0 4.0 Not Monitored < 5 5-9 10-49 50-199 ≥ 200
Dose to Lung (mSv) Relative Risk
917 cancers among 41,169 workers 96 cancers among 3,852 workers 17 cancers among 561 workers 28 cancers among 976 workers 5 cancers among 310 workers 5 cancers among 102 workers
Relative Risk 95% Confidence Limits 10 year lag 1 mSv = 100 mrem
1 2 3 4 5 6 7 8 9 10 11 12 13 14 Not Monitored > 0-4 5-9 10-49 ≥ 50
Dose to Bone Marrow (mSv) Relative Risk
80 cancers among 41,169 workers 1 cancer among 753 workers 9 cancers among 3,085 workers 2 cancers among 636 workers 4 cancers among 993 workers 2 cancers among 334 workers 1 cancer in the 50 – 99 range 0 cancers in the 100 – 199 range 1 cancer in the > 200 range
Relative Risk 95% Confidence Limits 1 mSv = 100 mrem Excludes chronic lymphocytic leukemia
2,251 1,596 655 215 23 2,715 1,979 736 241 27 500 1000 1500 2000 2500 3000
All Causes All Non-Cancer Causes All Cancers Lung Cancer Leukemia Number of Deaths
Observed Expected - based on mortality rates for California
0.0 1.0 2.0 Comparison Group (Other than SSFL Workers) < 5 yr 5-14 yr ≥ 15 yr
Years Worked at SSFL
Relative Risk (All Cancers)
2,086 cancers among 32,979 workers 405 cancers among 5,637 workers 204 cancers among 2,197 workers 48 cancers among 538 workers
Relative Risk 95% Confidence Limits
570 396 174 63 8 8
650 476 174 60 5 7 100 200 300 400 500 600 700
All Causes All Non-Cancer Causes All Cancers Lung Cancer Kidney Cancer Leukemia Number of Deaths Observed Expected - based on mortality rates for California
0.0 1.0 2.0 Comparison Group (SSFL Not a Test Stand Mechanic) < 1 yr 1-4 yr ≥ 5 yr
Years Worked as a Test Stand Mechanic Relative Risk (All Cancers)
151 cancers among 1,598 workers 35 cancers among 368 workers 81 cancers among 800 workers 58 cancers among 474 workers
Relative Risk 95% Confidence Limits
0.0 1.0 2.0 Comparison Group (SSFL Not a Test Stand Mechanic) < 1 yr 1-4 yr ≥ 5 yr
Years Worked as a Test Stand Mechanic Relative Risk (Lung Cancer)
59 cancers among 1,598 workers 10 cancers among 368 workers 31 cancers among 800 workers 22 cancers among 474 workers
Relative Risk 95% Confidence Limits
1,598 920 205 156 159 400 800 1200 1600
Comparison Group (SSFL Not Test Stand Mechanic) None Possible but Unlikely* < 1.5 yr ≥ 1.5 yr
Years of Potential Exposure to Hydrazines
*Most workers (>90%) did not work with hydrazines but could not be distinguished
101 68 33 15 2 114 84 30 10 1 20 40 60 80 100 120
All Causes All Non-Cancer Causes All Cancers Lung Cancer Kidney Cancer Number of Deaths Observed Expected - based on mortality rates for California
0.0 1.0 2.0 Comparison Group (SSFL Not Test Stand Mechanic) No Hydrazines Possible but Unlikely < 1.5 yr ≥ 1.5 yr
Years of Potential Exposure to Hydrazines Relative Risk (All Cancers)
151 cancers among 1,598 workers 92 cancers among 920 workers 24 cancers among 205 workers 17 cancers among 156 workers 16 cancers among 159 workers
Relative Risk 95% Confidence Limits
0.0 1.0 2.0 3.0 Comparison Group (SSFL Not Test Stand Mechanic) No Hydrazines Possible but Unlikely < 1.5 yr ≥ 1.5 yr
Years of Potential Exposure to Hydrazines
Relative Risk (Lung Cancer)
59 cancers among 1,598 workers 30 cancers among 920 workers 13 cancers among 205 workers 7 cancers among 156 workers 8 cancers among 159 workers
Relative Risk 95% Confidence Limits
1,598 329 695 416
400 800 1200 1600
Comparison Group (SSFL Not Test Stand Mechanic) No TCE < 4 yr ≥ 4 yr
Years of Potential Exposure to TCE
*Includes TCE exposure potential from engine flush and use as a utility solvent
391 270 121 51 7 451 330 121 41 3 50 100 150 200 250 300 350 400 450 500
All Causes All Non-Cancer Causes All Cancers Lung Cancer Kidney Cancer Number of Deaths Observed Expected - based on mortality rates for California
0.0 1.0 2.0 Comparison Group (SSFL Not Test Stand Mechanic) No TCE < 4 yr ≥ 4 yr
Years of Potential Exposure to TCE Relative Risk (All Cancer)
151 cancers among 1,598 workers 28 cancers among 329 workers 69 cancers among 695 workers 52 cancers among 416 workers
Relative Risk 95% Confidence Limits