
1 Rock Island, Illinois
Comprehensive Housing Market Study 2013
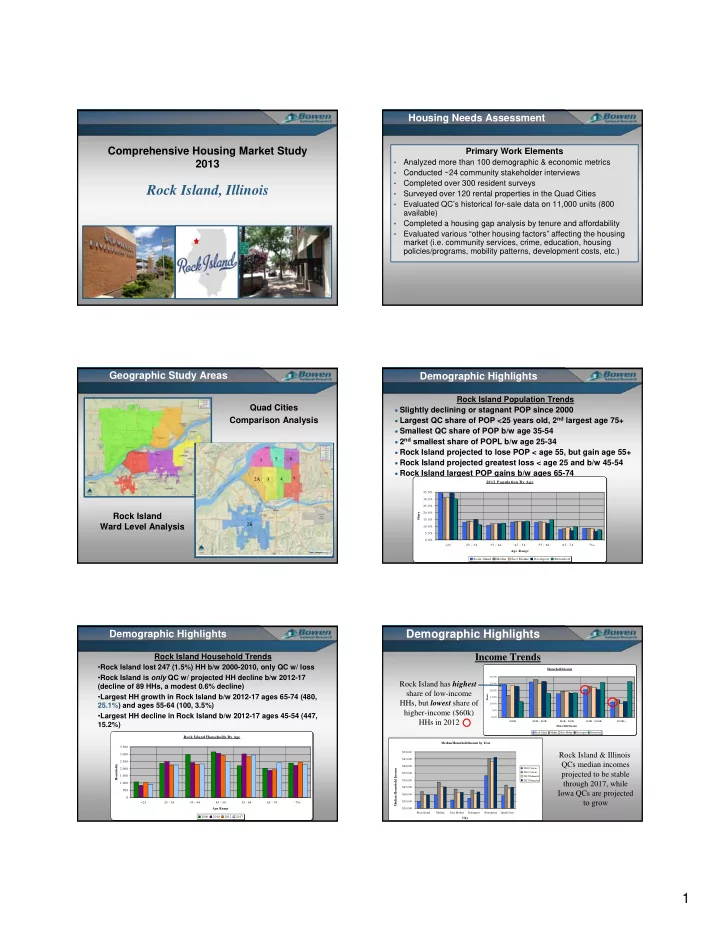
Housing Needs Assessment
Primary Work Elements
- Analyzed more than 100 demographic & economic metrics
- Conducted ~24 community stakeholder interviews
- Completed over 300 resident surveys
- Surveyed over 120 rental properties in the Quad Cities
- Evaluated QC’s historical for-sale data on 11,000 units (800
available)
- Completed a housing gap analysis by tenure and affordability
- Evaluated various “other housing factors” affecting the housing
market (i.e. community services, crime, education, housing policies/programs, mobility patterns, development costs, etc.)
Geographic Study Areas
Rock Island Ward Level Analysis Quad Cities Comparison Analysis
1 2A 5 6 3 4 7 2B
Rock Island Population Trends
Slightly declining or stagnant POP since 2000 Largest QC share of POP <25 years old, 2nd largest age 75+ Smallest QC share of POP b/w age 35-54 2nd smallest share of POPL b/w age 25-34 Rock Island projected to lose POP < age 55, but gain age 55+ Rock Island projected greatest loss < age 25 and b/w 45-54 Rock Island largest POP gains b/w ages 65-74
Demographic Highlights
2012 Population B y Age
0.0% 5.0% 10.0% 15.0% 20.0% 25.0% 30.0% 35.0% <25 25 - 34 35 - 44 45 - 54 55 - 64 65 - 74 75+ Age R ange Share Rock Island M oline East M oline Davenport Bettendorf
Demographic Highlights
Rock Island Household Trends
- Rock Island lost 247 (1.5%) HH b/w 2000-2010, only QC w/ loss
- Rock Island is only QC w/ projected HH decline b/w 2012-17
(decline of 89 HHs, a modest 0.6% decline)
- Largest HH growth in Rock Island b/w 2012-17 ages 65-74 (480,
25.1%) and ages 55-64 (100, 3.5%)
- Largest HH decline in Rock Island b/w 2012-17 ages 45-54 (447,
15.2%)
Rock Island Households By Age
500 1,000 1,500 2,000 2,500 3,000 3,500 <25 25 - 34 35 - 44 45 - 54 55 - 64 65 - 74 75+ Age Range Households 2000 2010 2012 2017 Household Income
0.0% 5.0% 10.0% 15.0% 20.0% 25.0% 30.0% <$20K $20K - $40K $40K - $60K $60K - $100K $100K+ Household Income Share Rock Island Moline East Moline Davenport Bettendorf
Demographic Highlights
Income Trends
Rock Island has highest share of low-income HHs, but lowest share of higher-income ($60k) HHs in 2012
Median Household Income by Year $30,000 $35,000 $40,000 $45,000 $50,000 $55,000 $60,000 $65,000 $70,000 Rock Island Moline East Moline Davenport Bettendorf Quad Cities City Median Household Income
2000 Census 2010 Census 2012 Estimated 2017 Projected