
SLIDE 1
1
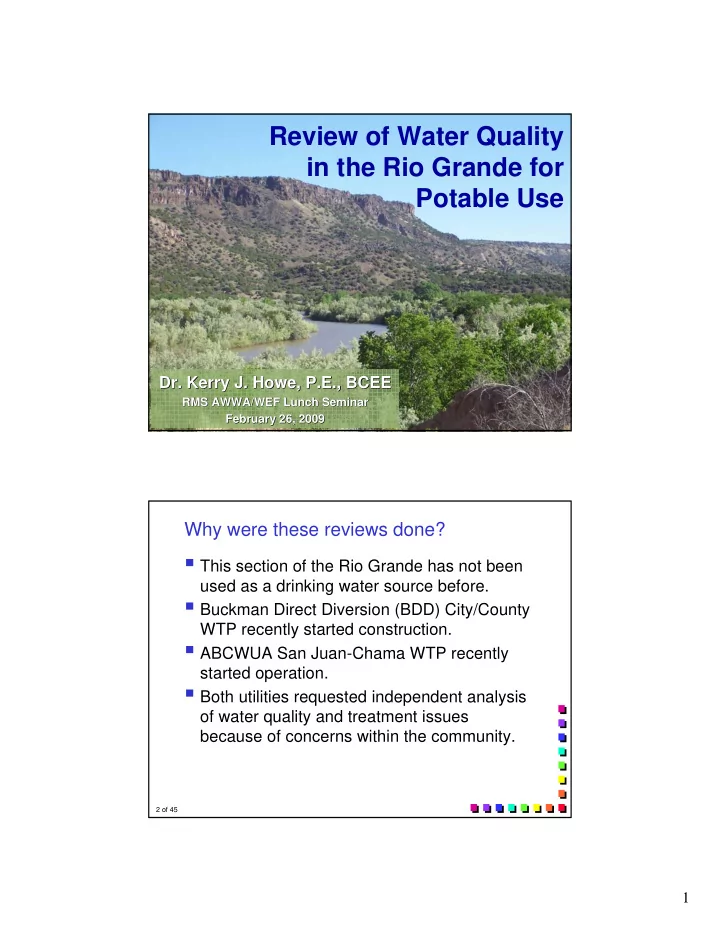
Review of Water Quality in the Rio Grande for Potable Use
- Dr. Kerry J. Howe, P.E., BCEE
- Dr. Kerry J. Howe, P.E., BCEE
RMS AWWA/WEF Lunch Seminar RMS AWWA/WEF Lunch Seminar February 26, 2009 February 26, 2009
2 of 45
Why were these reviews done?
This section of the Rio Grande has not been
used as a drinking water source before.
Buckman Direct Diversion (BDD) City/County
WTP recently started construction.
ABCWUA San Juan-Chama WTP recently
started operation.
Both utilities requested independent analysis
- f water quality and treatment issues