Retail Research 2 Shareholding Pattern: (As on June 30, 2010) - - PDF document

retail research
SMART_READER_LITE
LIVE PREVIEW

Retail Research 2 Shareholding Pattern: (As on June 30, 2010) - - PDF document

Zylog Systems Ltd. (ZSL) Stock Note High Risk July 16, 2010 HDFC Sec CMP Recommended Averaging Price Target Industry Time Horizon Scrip code (Rs.) Action Band (Rs.) (Rs.) ZYLSYSEQNR Buy at CMP and IT 508.5 460-475 612 1-2


slide-1
SLIDE 1

Retail Research

1

Stock Note

High Risk July 16, 2010

HDFC Sec Scrip code Industry CMP (Rs.) Recommended Action Averaging Price Band (Rs.) Target (Rs.) Time Horizon ZYLSYSEQNR IT 508.5 Buy at CMP and add on dips 460-475 612 1-2 quarters Company Background & Business Profile

Incorporated in 1995, Zylog Systems Ltd. (ZSL) is an ISO 9001 certified provider of Onshore, Offshore & Near shore technology solutions and services to enterprises & technology companies across the globe. ZSL is a niche IT services player with ~40% of revenues derived from IT products & related implementation and the balance from IT services. ZSL works with some of the world’s leading innovative ISVs (independent software vendors) and software-enabled businesses, ranging from start-ups to establish industry leaders. The company has technology partnership with well-known companies like Microsoft, HP, Dell, Sun, IBM, GUPTA, Brooktrou, TOrange Partner, Ubuntu and ECS. ZSL’s customer base includes large corporate organizations as well as medium size businesses across a broad range of verticals, as well as respected leaders in Finance & Banking, Insurance, Life Sciences, Telecommunications, Retail, and Manufacturing. Some of the ZSL’s key clients include reputed corporate names like Metlife, HSBC, JP Morgan Chase, GE, Barclays, IOB, SBI, Verizon, Pfizer & Daiichi Sankyo. The company offers a combination of onsite and offshore services depending on the client’s requirements and the nature of the project. ZSL provides complete Product Lifecycle Management services, ranging from new product development & product advancement to product migration, re-engineering, sustenance & support. By leveraging its experience in product engineering, it brings products to market faster, with high quality & reduced costs. ZSL leverages specialized knowledge in Custom Enterprise Application Development, Enterprise 2.0 Computing Services, Enterprise Reporting, Enterprise Data Management & Administration, Enterprise Application Integration, Mobile/Wireless/Web Application Development, Research & Development, IT Infrastructure Management, Replacement Technology Services, QA & Testing, BPO Services. Some of its key product offerings include Mobile banking system, RTGS pay manager, AML-Detector, Cheque truncation system, Claims Management system, iPage-Forms Processing, D P online, Zymobile server, Z*connect, MS Dynamics, iVARS TM, zPrism.

Zylog Systems Ltd. (ZSL)

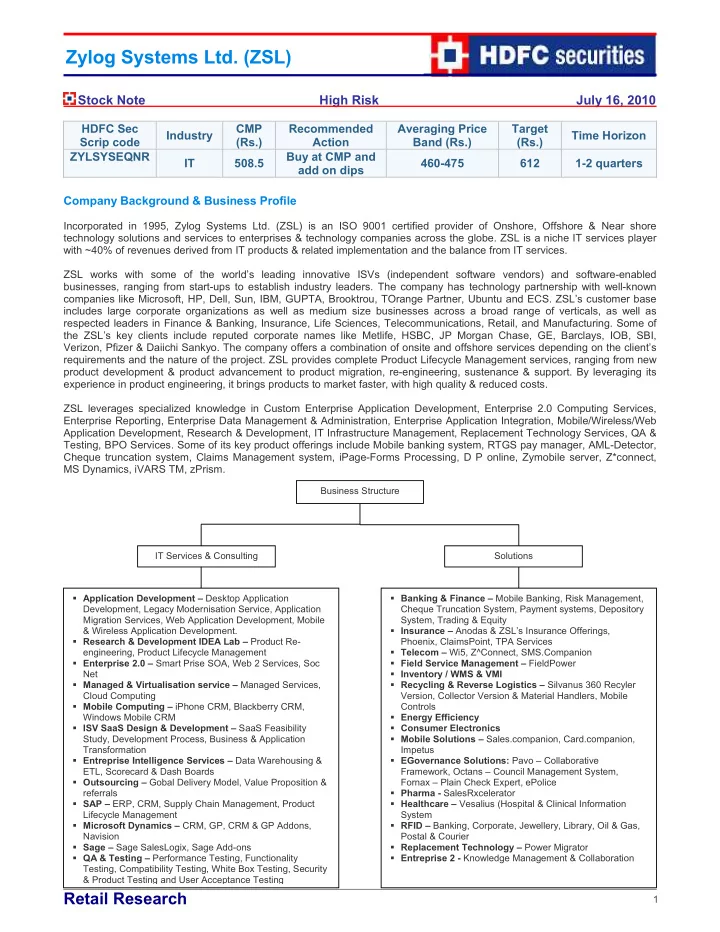
Business Structure IT Services & Consulting Solutions

  • Application Development – Desktop Application

Development, Legacy Modernisation Service, Application Migration Services, Web Application Development, Mobile & Wireless Application Development.

  • Research & Development IDEA Lab – Product Re-

engineering, Product Lifecycle Management

  • Enterprise 2.0 – Smart Prise SOA, Web 2 Services, Soc

Net

  • Managed & Virtualisation service – Managed Services,

Cloud Computing

  • Mobile Computing – iPhone CRM, Blackberry CRM,

Windows Mobile CRM

  • ISV SaaS Design & Development – SaaS Feasibility

Study, Development Process, Business & Application Transformation

  • Entreprise Intelligence Services – Data Warehousing &

ETL, Scorecard & Dash Boards

  • Outsourcing – Gobal Delivery Model, Value Proposition &

referrals

  • SAP – ERP, CRM, Supply Chain Management, Product

Lifecycle Management

  • Microsoft Dynamics – CRM, GP, CRM & GP Addons,

Navision

  • Sage – Sage SalesLogix, Sage Add-ons
  • QA & Testing – Performance Testing, Functionality

Testing, Compatibility Testing, White Box Testing, Security & Product Testing and User Acceptance Testing

  • Banking & Finance – Mobile Banking, Risk Management,

Cheque Truncation System, Payment systems, Depository System, Trading & Equity

  • Insurance – Anodas & ZSL’s Insurance Offerings,

Phoenix, ClaimsPoint, TPA Services

  • Telecom – Wi5, Z^Connect, SMS.Companion
  • Field Service Management – FieldPower
  • Inventory / WMS & VMI
  • Recycling & Reverse Logistics – Silvanus 360 Recyler

Version, Collector Version & Material Handlers, Mobile Controls

  • Energy Efficiency
  • Consumer Electronics
  • Mobile Solutions – Sales.companion, Card.companion,

Impetus

  • EGovernance Solutions: Pavo – Collaborative

Framework, Octans – Council Management System, Fornax – Plain Check Expert, ePolice

  • Pharma - SalesRxcelerator
  • Healthcare – Vesalius (Hospital & Clinical Information

System

  • RFID – Banking, Corporate, Jewellery, Library, Oil & Gas,

Postal & Courier

  • Replacement Technology – Power Migrator
  • Entreprise 2 - Knowledge Management & Collaboration
slide-2
SLIDE 2

Retail Research

2 ZSL inaugurated its state-of-the-art facility at the IT corridor in Sholinganallur, Chennai in 2008. The new facility inaugurated, is spread over 1.1 acres of land and will be its biggest facility in India with 85,000 sq feet of built-in area. ZSL plans to recruit 4000 more employees in India over the next two to three years, which will substantially enhance its global strength. This is ZSL’s second facility in Chennai, and complements an existing 30,000 square feet facility in T. Nagar. The new facility hosts a total seating capacity of 850 employees. ZSL derives almost all its revenues from the overseas markets. The company has a strong geographic footprint across North America, Western Europe, APAC and Middle East. US market accounts for more than 90% of the total revenues. As of Dec 2009, the total employee strength stood around 2,018 employees with 75% being technical staff strength. ZSL has five wholly owned subsidiaries (direct), which together account for 20% of ZSL’s consolidated revenues (in FY10, including Brainhunter’s financials, which was acquired in February 2010). The subsidiaries’ contribution has increased significantly from only 2% in FY09 & 0.5% in FY08. Subsidiaries Chart: Brief description of subsidiaries: Vishwa Vikas Services Ltd: This subsidiary was incorporated as a public limited Company on March 17, 2004. It obtained a commencement certificate for its business on April 15,2004. The company is engaged in the business of setting up facilities in India and elsewhere for data processing, data conversion, data entry, document management, data preparation, document report generation; IT enabled services of all kinds, software services. In FY09, the company reported revenue of Rs. 31.9 mn (FY08: Rs. 21.5 mn), an increase of 48.4%. PAT rose 2.4 times to Rs. 14.5 mn. Zylog Systems (India) Ltd: Zylog Systems India Ltd. was incorporated as a public limited Company on December 28, 2005 &

  • btained a commencement certificate for its business on January 25,2006. The company is engaged in the business of

providing software services to Indian markets. Its revenue in FY09 increased by 7.6% to Rs.14.1 mn, while PAT increased from Rs. 0.1 mn in FY08 to Rs. 0.8 mn in FY09. Zylog Systems Asia Pacific Pte Ltd: Zylog Systems (Asia Pacific) Limited was incorporated as a public limited Company on February 22, 2006. It was incorporated to engage in the business of Software Development Services And Consulting. In FY09, the company recorded 97.6% jump in its revenues (over FY08), which stood at Rs. 25.1 mn, while net profit increased significantly to Rs. 4.1 mn in FY09 from Rs. 0.5 mn in FY08. Zylog Systems (Europe) Ltd: Zylog Systems (Europe) Limited was incorporated as a public limited Company on August 5,

  • 2005. It was incorporated to engage in the business of hardware and software consultants, install and established

communication systems, establish and run training facilities and to develop or manufacture hardware and software. The company’s revenue increased by 601.6% to Rs. 172.7 mn in FY09. However, the net loss increased from Rs. 5.8 mn in FY08 to Rs. 9.3 mn in FY09. Zylog BV Limited: During FY09, ZSL incorporated a wholly owned subsidiary, Zylog BV Limited in British Virgin Islands. The company entered into an agreement with the shareholders of Ducont FZ LLC, a Dubai based company for acquiring 100% of shares of that company. Now, Ducont FZ LLC has become 100% wholly owned subsidiary of Zylog BV Ltd. In FY09, Zylog BV Ltd generated maiden revenue of Rs. 5 mn with a net loss of Rs. 16.7 mn. The company is confident of getting greater revenues from the proposed acquisition Ducont FZ LLC in the forthcoming years. New Acquisition In February 2010, ZSL acquired a loss-making company named ‘Brainhunter’ (BH), one of the largest staffing companies in Canada for USD 33 mn through Company’s Creditors Arrangement Act (CCAA). BH derives around 95% of its revenues from providing IT and engineering staffing consultants on a contract basis to its clients. In FY09, it reported revenues of US$ 194 mn with PAT margins of about 0.1%. Since the acquisition was made in Feb 2010, the FY10 consolidated accounts of ZSL seems to be including 1-1.5 months of BH’s financials. Zylog Systems Ltd. Zylog BV Ltd. Vishwa Vikas Services Ltd Zylog Systems (India) Ltd Zylog Systems Asia Pacific Pte Ltd Zylog Systems (Europe) Ltd

slide-3
SLIDE 3

Retail Research

3

Shareholding Pattern: (As on June 30, 2010)

Particulars No of Shares (In Mn) % of Holding Institutions 1.1 6.4 Non Promoter Corporate Holding 2.2 13.3 FII 1.0 6.1 Promoters 5.9 36.1 Public & Others 6.2 38.1 Total 16.4 100 Argonaut Ventures (2.31%), BNP Paribas Arbitrage (1.98%), GIC India (2.45%), Kotak Mahindra Prime (2.55%), United India Insurance (3.62%), UTI Inv Advisory Services (6.99%) are some large institutional shareholders in the company.

Investment Rationale Acquisition of Brainhunter (BH) – A strategic move

In Feb 2010, ZSL acquired a loss-making company named ‘Brainhunter’ (BH), one of the largest staffing companies in Canada for C$35 mn (USD 33 mn) through Company’s Creditors Arrangement Act (CCAA). BH derives around 95% of its revenues from providing IT and engineering staffing consultants on a contract basis to its clients. Around 30% of the services rendered are to various Federal Government of Canada agencies and departments. Also, BH has a wide spread client base of over 400 Blue-chip organizations across various sectors including BFSI, Information Technology, Telecom, Government and oil &

  • pipeline. In FY09, it reported revenues of US$ 194 mn with PAT margins of about 0.1%. The acquisition would be funded

through a mix of internal accruals (C$10 mn) & borrowings (C$25 mn). ZSL has been looking to enter Canada for its operations and this acquisition would provide the company with the appropriate

  • platform. The target caters to Government departments, BFSI and Telecom, which are the key focus segments for ZSL.

Hence, there is high potential for cross-sell. The acquisition will provide ZSL ready access to BH’s large talent pool, over 1,400 contractors and more than 400 customers. The deal will also help ZSL save costs on account of offshoring contracts, sourcing

  • f contractors from India for non-government businesses and further reduction in non-billable staff. The IT spends of the

Federal Government of Canada and the banks have increased Y-o-Y and this trend is expected to continue, which in turn is expected to drive ZSL’s consolidated revenues going forward. The rationale and strategic fitment of this acquisition is given below in the table: Attractiveness Cost Synergies Revenue Synergies

Leading professional services firm in

Canada

Ready access to a large talent pool,

1400+ contractors, 400+ diversified customer base with extensive preferred vendor relationship, 35+ Government departments serviced, 40+ customers contributing individually to >C$ 1 mn revenues.

On-going restructuring activities to

improve margins

Technology platform Potential to save costs on account of

  • ffshoring of certain contracts

Sourcing of contractors from India for

non government businesses

Further reduction in non-billable staff Savings on account of delisting BH Optimizing operating leverage by

streamlining infrastructure costs and

  • ther administrative costs to further

realize scaled economies in the combined business. There is significant potential to:

  • Establish a strong footprint in

Canada

  • Service existing customers of

ZSL in Canada

  • Diversifying revenue streams by
  • ffering comprehensive IT

solutions to the existing customers of BH other than consulting services.

  • Cross-selling ZSL’s solutions &

services offerings to BH customers

Plans to expand the Wi-Fi wireless broadband services

ZSL (through its 100% subsidiary Zylog Systems India) has installed 250 wireless nodes across Chennai and 4,000 more nodes are anticipated to be operational in the city in 12-15 months. With the Chennai launch, ZSL has entered the ISP business in India. The company has ‘category A’ internet service provider licence to operate in all of India’s DoT circles. Zylog Systems (India) has plans to invest Rs. 2000 mn to expand its ‘Wi-Fi’ wireless broadband services in five metropolitan cities Delhi, Bengaluru, Mumbai, Hyderabad and Kolkata in coming two years. The goal is to reach a million customers and implement Wi-Fi in five metros within 18 months. The company will roll out the service in some cities by mid-2010. The intent of this Wi-Fi pilot was to get the user experience and to perfect the technology to the Indian conditions. Both

  • bjectives have been met. Wi-Fi is different from hot spots as it gives ubiquitous mobile coverage - a user need not login in

whenever he gets into the zone where the company offers the Wi-Fi once he gets a user name and password. The company is also targeting the digital subscriber line (DSL) customers. ZSL expects this venture to generate ~Rs. 5 bn revenues over the

slide-4
SLIDE 4

Retail Research

4 next five years. The overall Indian Wi-Fi market is set to exceed $744 mn (around Rs. 37.2 bn) by 2012. ZSL would also lease its infrastructure and expand overseas, especially in the developing countries, after the complete roll out of the service in India. Diversification in Wi-Fi market will ensure strong foothold in the ever-growing telecom industry in India. Nomad Digital, UK based Wi-Fi technology major, along with ZSL forayed a joint venture to provide wireless internet access to India’s massive railway network. Nomad Digital has one of the biggest market share in the domain of providing mobile wireless services for transportation. On the other hand, its Indian counterpart ZSL provides a range of IT products and solutions to its customers across multiple sectors such as banking, insurance and telecom. Hence, the synergetic JV is expected to benefit Indian Railways.

Planning to expand presence in e-governance segment through inorganic route

ZSL also plans to expand its presence in e-governance segment by acquiring two overseas companies by the end of FY11. The company is looking at acquisition targets in the US and the Asia-Pacific as a way to get the US government business. ZSL would also take the products and solutions of companies acquired by them to other governments and other countries. ZSL, has strengthened its offerings and reach through strategic acquisitions made over the past five years. ZSL has successfully integrated the acquired products, solutions and services into its suite of offerings. These acquisitions have helped the company to penetrate the market deeper and cross-sell its newly acquired offerings to complementary markets. ZSL has made five inorganic initiatives (including BH acquisition) in last five years, the details of which are given below:

  • In Feb 2008, ZSL, through its subsidiary Zylog Systems (Europe) Ltd. acquired Anodas Software Ltd. (UK) for £1.6 mn,

which is engaged in providing of software solutions, consultancy and administration to the insurance sector.

  • In Nov 2008, ZSL completed the acquisition of 80% stake in PEQ consulting Inc (US, Ohio) for $2.5 mn and 100%

acquisition of Fairfax Consulting Inc. (US) for $7.5 mn (through its 100% subsidiary Zylog BV Ltd.). PEQ Consulting, Inc.

  • perates as an information technology services and solutions company. It offers technical services, network services,

cabling services, software training, asset management, and outsource management. The company also offers information technology infrastructure support, server migrations and upgrades, current configuration, infrastructure discovery and documentation, PC installations, etc. Its Core focus is Automotive Industry and derives substantial portion of its revenue from that vertical. It is a national service provider spread across USA & Canada. Fairfax is pioneering in Content processing within the enterprise information management (ElM) space. Content processing is the capture, translation and deployment

  • f all business content (documents, web content, digital assets). It operates in the Pharma and healthcare verticals thus

building the critical expertise for ZSL.

  • Further in FY09, ZSL, through Zylog BV Ltd., entered into an agreement to acquire 100% stake in Dubai based company

Ducont FZ LLC for $7.5 mn. Ducont is a leading application provider in Internet and wireless applications. It provides mobile banking, e-governance solutions to marquee clients, which include 30 banks. The acquisition has provided ZSL a strong foothold in the Middle East region apart from the cross selling opportunities to Zylog clients. All these above acquisitions were funded through a mix of internal accruals and borrowings. ZSL is now focusing on a couple of more acquisitions in the e-governance services & solutions space to acquire newer customers and provide cross-selling opportunities. For this ZSL is in talks with various companies in e-governance segment with revenue of less than Rs 500 mn ($10 mn). ZSL has the board approval to go ahead with two target companies, one in USA (which specialises in development of advanced technology products and solutions to federal, state, local governments) and the other in Asia Pacific region (Malaysia / Singapore which specialises in E-governance, Health care solutions and Hospital Management). These acquisitions when completed would enable ZSL to expand its presence in the e-governance segment and to strengthen its offering and client base further.

BH acquisition to increase the consolidated revenues significantly, however reduction in offshore utilisation rates & relatively low margins of BH to pull down the margins

ZSL’s Turnover has grown at a CAGR of 34% over FY07-10, which was driven both organically & inorganically. Strong growth was reported across all its verticals viz; BFS, Retail, Manufacturing, Healthcare & Telecom. In FY11, we expect ZSL’s turnover to increase significantly by 84.1%, mainly on the back of acquisition of BH in February 2010. We expect the standalone revenues to grow by 9% over FY10, while the subsidiaries revenues (including BH) are expected to shoot up by 383.7% in

  • FY11. Growth is expected to be visible across all the ZSL’s business verticals. BH revenues are likely to account for ~47% of

ZSL’s total consolidated revenues & ~89.5% to the subsidiaries’ turnover. The improvement in the IT spends of the Federal Government of Canada and the banks is expected to benefit BH & ultimately ZSL going forward, since BH renders 30% of its services to various Federal Government of Canada agencies & departments.

slide-5
SLIDE 5

Retail Research

5 ZSL’s new initiatives in the Wi-Fi Internet services and e-governance space are expected to drive the revenues further going

  • forward. The company is likely to roll out the Wi-Fi service in some cities by mid-2010, which could boost its revenues in FY11

though it could take time to be profitable. The chart below gives an overview of ZSL’s consolidated turnover since FY08 along with our projections for FY11:

18040.4 7497.9 6090.9 9799.4 84.1 23.1 30.7 49.5 2000 4000 6000 8000 10000 12000 14000 16000 18000 20000 FY08 FY09 FY10 FY11E Year End Sales (Rs. In Mn) 10 20 30 40 50 60 70 80 90 Growth rate (%) Value % grow th rate

ZSL’s consolidated operating profit has grown at a CAGR of 30% over FY07-10, while OPM has declined from 16.9% in FY08 to 15.6% in FY10. OPM had dipped significantly to 9.6% in FY09 on the back of substantial increase in software development cost & selling & admin expenses. However, it recovered sharply in FY10 on account of cost control initiatives. ZSL managed to reduce the employee cost as a % to turnover significantly from 58.1% in FY09 to 47.9% in FY10. However, these margins are unlikely to sustain in FY11 on the back of reduction in offshore utilisation rates & lower BH margins. ZSL has higher proportion

  • f onsite billing (around 65%), which offers lower gross margins (as compared to offshore service) due to higher costs in

providing such services, such as travel, accommodation and allowance costs. Further BH’s operating margins are relatively much lower at around 2.5-3% compared to ZSL’s standalone margins, which stood at 19.6% in FY10. Hence, we expect ZSL’s consolidated OPM to fall sharply by 463 bps to 11% in FY11, while the absolute operating profit is expected to grow by 29.6% (much lower than the turnover growth). ZSL’s PAT has grown at a CAGR of 23.2% over FY07-10, while its PAT margins have declined from 13.5% in FY08 to 10.5% in FY10. Lower operating margins coupled with higher interest cost (on account of additional borrowings to fund BH acquisition) & increasing tax rates in ZSL’s IT solutions business is further expected to drag ZSL’s consolidated PAT margins lower by 347 bps to 7% in FY11. PAT is expected to grow by 22.8%. The charts below give an overview of ZSL’s Operating Profit & PAT (conso) since FY08 along with our projections for FY11:

1531.3 1028.1 715.8 1984.4 11.0 15.6 9.5 16.9 500 1000 1500 2000 2500 FY08 FY09 FY10 FY11E Year End

  • Opt. Profit (Rs. in Mn)

2 4 6 8 10 12 14 16 18 Percentage (%) Value % of sales 821.6 845.1 1024.5 1258.3 10.5 13.5 11.3 7.0 200 400 600 800 1000 1200 1400 FY08 FY09 FY10 FY11E Year End PAT (Rs. in Mn) 2 4 6 8 10 12 14 16 Percentage (%) PAT (Value) % of sales

slide-6
SLIDE 6

Retail Research

6

Industry Outlook

Industry Structure The fiscal year 2009-10 can be described as a year of economic instability. The mortgage and fiscal crisis took on the global economy, followed by unemployment, declining GDP and weakened demand environment. IT industry was also affected adversely by this turmoil. The technology related spending was reduced drastically. There was not much uptick in the demand scenario and pricing pressures were felt across the industry with clients emphasizing on contract renegotiation. Some customers went bankrupt, while others were delaying the payments and deals. With the rapidly changing macro-economic scenario, customer demands and expectations have also changed. Customers are maintaining a cautious approach while spending money on their IT requirements. They are also looking for optimum utilization

  • f that money by deriving maximum value in the products and solutions offered. This has emphasized the need for

transformation in business models and service delivery, while bringing in more flexibility. The industry is looking to diversify beyond its key offerings and markets, defining new business and pricing models, transforming the delivery process through technology innovation and thus ensuring cost efficiency. Improvement in demand being witnessed over the last two quarters The demand scenario has however improved in the last two quarters of FY 2009-10 with improving deal flow, volume growth, stable pricing and faster decision-making cycle. These improving economic conditions indicate towards return of customer confidence and growth revival. Mergers and acquisitions are back in place, while the leading tech firms are going on a hiring

  • spree. IT services is expected to grow at a decent rate in the coming years, as companies coming out of recession are now

looking at IT for achieving the competitive edge. According to a study by Springboard Research, the Indian IT services market is estimated to remain the fastest growing in the Asia-Pacific region with a CAGR of 18.6%. The Indian IT industry has played a key role in putting India on the global map. As per NASSCOM, IT sector revenue has risen from 1.2% of GDP in FY98 to an estimated 5.8% in FY09. Globally, India's IT growth is primarily dominated by IT software and services such as Custom Application Development and Maintenance (CADM), System Integration, IT Consulting, Infrastructure Management Services, Software Testing, Application Management, Service-oriented architecture and Web

  • Services. According to NASSCOM, the Indian IT-BPO sector grew by 12% in FY09 to reach US$ 71.7 bn in aggregate

revenue (including hardware). Of this, the software and services segment accounted for US$ 59.6 bn. IT-BPO exports grew by 16% from US$ 40.9 bn in FY08 to US$ 47.3 bn in FY09. The IT industry is estimated to aggregate revenues of USD 73.1 bn in FY2010, with the IT software and services industry accounting for USD 63.7 bn of revenues. Export revenues are estimated to gross USD 50.1 bn in FY2010, growing by 5.4%

  • ver FY2009, and contributing 69% of the total IT-BPO revenues. Software and services exports (incl. BPO) are expected to

account for over 99% of total exports, employing around 1.8 mn employees. The engineering design and products development segments that involve IP driven service capabilities command an exports revenue share of 20%, generating revenues of USD 10 bn in FY2010, growing by 4.2%. BPO industry to lead the overall Indian IT Industry growth As per Nasscom, the Indian IT industry is expected to grow by 13-15% in 2010-11 fiscal, led by the BPO industry, which is expected to grow by 15-16%. As per 'NASSCOM Perspective 2020: Transform Business, Transform India’ report, India’s IT/BPO Exports could range from $65 bn to $75 bn in FY12. From a very long-term perspective, by 2020, Nasscom expects growth in domestic BPO revenues to expand seven-folds to reach $15-17 bn by 2020. This domestic growth will spell out

  • pportunities for the youth & more employment opportunities especially in tier two & three cities with setting up of centres in

smaller cities & towns. The export revenues are expected to expand more than fourfold & reach $50 bn in revenues by 2020. Outsourcing / Offshore – major catalyst for future growth Outsourcing the development and maintenance of technological solutions is inevitable in the present scenario. Offshore is the preferred destination for the companies based overseas as they get the same quality of service for less than 1/3 rd of the cost. Indian IT companies also have an equal advantage in terms of their profitability, lesser cost on IT infrastructure and human resources, greater flexibility in scheduling. For these reasons companies are increasingly turning to offshore technology

  • services. As a result, offshore technology service will become competitive and critical to sustain and grow in recognition and
  • sophistication. At the same time the range of offshore IT services is expected to increase.

India – one of the most preferred destinations for outsourcing India continues to be the most preferred destination for companies looking to offshore their IT and back-office functions. India's most prized resource is its readily available technical work force. The country has retained its numerous Uno position even as some other well-established outsourcing hubs dropped in their attractiveness to be replaced by new emerging destinations in

slide-7
SLIDE 7

Retail Research

7 AT Kearney’s latest ranking of the top outsourcing destinations across the globe. The top three countries in the 2009 Global Services Location Index (GSLI) remain the same - India, China and Malaysia. BPO 3.0 – emergence of a new era in BPO Organizations of the 3.0 era are moving away from being mere back office, transaction based support outfits to being business partners to their clients. Clients want these organizations to share their risk, partner with them through the downturn and thereby reap the rewards with them as well. Business transformation is the new mantra of the industry. But this comes with some challenges. The most critical one is still finding the right talent. While the work being outsourced is now highly complex & needs a deeper understanding of client needs, & accordingly, the workforce needs to be highly skilled & competent as well. BPO 3.0 heralds the emergence of the industry beyond just being the back office to the world. The move to BPO 3.0 would involve value enhanced end-to-end solutions, shared vision with customer on driving transformation and enterprise-wide cost

  • efficiencies. The drivers of the growth would include new sectors like healthcare, and new markets BRIC (Brazil, Russia, India,

China), Japan, Germany. It would also include new service lines (process transformation for productivity improvement) and new social, environmental and technology trends. Domestic IT services demand to grow at 18% CAGR over the next five years In 2008-09, the size of the domestic IT services market stood at an estimated Rs 275 bn, which is about 20% of the Indian IT services industry. Over FY06-09, this number is estimated to have grown by a CAGR of 24%. Growth was chiefly led by IT services spends in the BFSI, telecom and government verticals, which together accounted for nearly 75% of total domestic IT services spends in FY09. CRISIL Research expects the domestic IT services market to grow at an 18% CAGR over the next 5 years to Rs 650 bn in FY14, the primary drivers for this being: i) Government – Increased usage of IT services for e-Governance projects, defence purposes & delivery of utility services to the masses ii) BFSI – Computerization of branches and integration of systems to promote cross selling. iii) Telecom – Existing players increasingly outsourcing non-core operations and entry of new operators. iv) Manufacturing – Integrating ERP with shop-floor and implementing business intelligence tools v) Sectors like retail, education and healthcare increasing IT adoption as more players become organised Although the outlook for domestic IT services is positive, players are likely to experience volatility in growth. This can be attributed to the frequent delays in decision making and implementation, especially in government projects, and the nature of contracts, most of which are project-based and billed on a fixed price basis. On the contrary, around 60% of contracts in the exports markets are executed on a time and material basis. Thus, as a result of the project-based nature of contracts and lower billing rates, operating margins in the domestic IT services tend to be much lower than in the exports market.

Competitive Profile:

The IT services market is highly competitive. ZSL’s competitors include large global consulting firms, sub-division of large multinational technology firms, IT outsourcing firms, Indian IT services firms, software firms and in-house IT departments of large corporations. Some of the major Indian IT players giving stiff competition to ZSL include Infosys, Wipro, TCS, HCL Technologies, Mind tree & KPIT Cummins Infosystems. ZSL also faces competition from global IT players in all the verticals where it is present. Under the BFSI and Telecom vertical, the major competitors are Covansys Corp, Michigan, Syntel Inc, Michigan, and HCL

  • Technologies. Trizetto Group, California is its competitor in the health care and insurance services. MTM Technologies,

Connecticut are the competitors in the Managed Services Business. RWD Technologies & Maryland compete ZSL in intelligence segment. The increasing attractiveness of the Global Delivery Model is forcing the overseas-based competitors to expand their base in

  • India. In the future, competition is expected from firms establishing and building their offshore presence and from firms in

countries with lower personnel costs than those prevailing in India. However, it should be noted that price alone cannot constitute sustainable competitive advantage. The competitors have also indulged in aggressive poaching of talent, especially for experienced IT professionals. In the tables below, we have compared ZSL with Mind Tree & KPIT Cummins, as their business size is almost similar. At CMP, ZSL trades at 6.6xFY11E EPS, which is at a substantial discount to its peers. This is mainly because ZSL commands relatively lower operating & PAT margins as compared to them. Further in FY11, though we expect ZSL’s revenues to increase significantly on the back of BH acquisition, this acquisition is expected to pull down the OPM & PAT margins significantly due to relatively lower margins of BH. However, value wise, the operating profit & PAT would continue to grow. Also, we feel that in the long run, the margins of BH could improve gradually, since this acquisition would enable ZSL to save costs on account of offshoring contracts, sourcing of contractors from India for non-government businesses and further reduction in non-billable staff. This is likely to improve company’s valuations going forward. Further, ZSL is looking to acquire two more companies in US & Asia Pacific region (Malaysia) by the end of FY11 to expand its presence in the e-governance

slide-8
SLIDE 8

Retail Research

8

  • segment. If these acquisitions take place, then ZSL’s FY11 sales & profits could be higher than our estimates. This could

result in re-rating of this stock & could narrow the current discount in PE. Moreover, the growth in size of business due to the latest acquisition & the scope/potential of BH acquisition could result in renewed interest in the stock and lead to re-rating.

Peer Comparison: FY10:

Company Name OPM (%) NPM (%) EPS (Rs.) CMP (Rs.) PE

  • Mark. Cap

(Rs. In Mn) Net Sales (Rs. In Mn) Mk. Cap/Sales Mind Tree 18.9 16.6 54.4 573.4 10.5 22655.0 12959.8 1.7 KPIT Cummins Infosystems 22.1 11.7 10.9 144.4 13.2 11335.4 7316.4 1.5 ZSL 15.6 10.5 62.3 508.5 8.2 8364.8 9799.4 0.9

(Source: Company, HDFC Sec)

FY11E:

Company Name OPM (%) NPM (%) EPS (Rs.) CMP (Rs.) PE

  • Mark. Cap

(Rs. In Mn) Net Sales (Rs. In Mn) Mk. Cap/Sales Mind Tree* 15.9 11.0 40.6 573.4 14.1 22655.0 14930.0 1.5 KPIT Cummins Infosystems* 18.1 10.3 11.0 144.4 13.1 11335.4 8414.0 1.3 ZSL 11.0 7.0 76.5 508.5 6.6 8364.8 18040.4 0.5

(Source: Company, HDFC Sec) * - In case of Mind Tree & KPIT Cummins, consensus estimates have been taken for FY11

Risks and concerns The future demand for ZSL’s products would depend on acceptance of service offerings in the domestic & international

markets, ability to keep pace with technological changes and ability to provide innovative services. Any slowdown in demand for the services would result in lower utilization rates thus negatively impacting revenues and gross margins.

India has been a preferred outsourcing location due to its lower labour costs. If wages in India increase at a faster rate

than in the US and other target European markets, ZSL would see higher employee costs (particularly project managers and other midlevel professionals).

Jobs performed onsite are charged higher rates and generate higher revenues. However the gross margins from onsite is

  • lower. Any increase in work performed at client sites located outside India would decrease the gross margins due to

higher costs in providing such services, such as travel, accommodation and allowance costs. ZSL already has a high

  • nsite presence (effort mix - 65:35 in favour of onsite). Hence though its revenue growth could be high, the margins could

dip if the revenue mix increases further in favour of onsite.

ZSL earns almost all its revenues from the overseas markets with more than 90% of the revenues coming from the US

  • market. This exposes ZSL to the forex fluctuations (mainly Re/$). Significant rupee appreciation could impact ZSL’s

revenues & margins. However, according to the management, almost 80% of its revenue is naturally hedged as it pays

  • ut salaries and incurs expenditures in the same foreign currency. Dependency on US could also mean that in case US

faces a slowdown once again, then the visibility for ZSL could get blurred temporarily.

Increasing tax rates in IT solutions business due to withdrawal of STPI benefits & increase in the MAT rate could impact

ZSL’s net profitability going forward. ZSL’s effective tax rate (conso) increased from 12.4% in FY09 to 21.2% in FY10.

Immigration policies of US and European policy makers and any inability to obtain visas would restrict ZSL’s ability to

provide services to international clients and hence negatively impact the business. Further in case there is a backlash against outsourcing in the west, it could affect the export of services by ZSL.

Over time, ZSL is expected to face significant competition in the Wi-Fi space from the telecom majors, which could put

pressure on its margins.

BH is a larger company (in revenues terms) than Zylog and is into staffing solutions, while other acquisitions were small in

size and in the IT solutions space. Also, BH had filed for Companies' Creditors Arrangement Act to avoid bankruptcy. Hence, successful and fast integration of BH is a key challenge. Further dependency of BH on the Canadian Govt and its spending is high. In case this spending is cutback due to any reason, then it could affect revenues of BH.

slide-9
SLIDE 9

Retail Research

9

Highlights of latest results:

Q4FY10 (Standalone)

  • ZSL’s revenues increased by 16.5% Y-o-Y & 5.1% Q-o-Q to Rs. 2118.4 mn [Q4FY09: Rs.1818.7 mn; Q3FY10: Rs. 2016.5

mn].

  • Operating Profit stood at Rs. 425.1 mn, which turned around from a loss of Rs. 60.4 mn in Q4FY09. However, sequentially,

it declined marginally by 2.7% on the back of higher operating cost. Operating margins stood at 20.1% in Q4FY10, lower by 159 bps sequentially.

  • PAT increased by 126.9% Y-o-Y & 7.4% Q-o-Q to Rs. 265.9 mn, while the PAT margins improved by 611 bps Y-o-Y & 27

bps Q-o-Q to 12.6%. EPS for the quarter stood at Rs. 16.2 vs. Rs. 7.1 in Q4FY09 & Rs. 15.1 in Q3FY10. FY10 (Consolidated)

  • ZSL’s revenues rose 30.7% to Rs 9799.4 mn [FY09: Rs. 7497.9 mn]. Banking, financial services and insurance verticals

contributed nearly 31% to the total revenues. Their revenue contribution increased from 29.7% in FY09. New regions like Canada & Middle East accounted for 15.5% of total revenues. Revenues from companies acquired during FY10 amounted to Rs. 1200 mn or 12.5% of the consolidated revenue.

  • Operating Profit grew by 113.9% to Rs. 1531.3 mn [FY09: Rs. 715.8 mn], while OPM improved significantly from 9.6% in

FY09 to 15.6% in FY10 due to lower employee cost.

  • However, PAT growth was lower at 21.2% at Rs. 1024.5 mn [FY09: Rs. 845.1 mn] on the back of higher interest cost,

depreciation & tax expense. EPS for the year stood at Rs. 62.3 vs. Rs. 51.4 in FY09.

Conclusion & Recommendation:

We expect ZSL’s consolidated net sales to increase significantly by 84.1% in FY11. Growth is expected to be visible across all the ZSL’s business verticals. With the revival in the global IT spends & continued synergies playing out of the past acquisitions, ZSL’s IT solutions segment is expected to do well over the next few years. While the standalone revenues are expected to grow by 9%, the sharp spike expected in consolidated sales is mainly on account of consolidation of BH financials. The subsidiary is expected to contribute ~47% to ZSL’s total consolidated turnover & 89.5% to the subsidiaries’ turnover. With the increase in IT spends of the Fed. Govt. of Canada and the banks, BH is expected to perform well going forward. ZSL’s new initiatives in the Wi-Fi Internet services & e-governance space are expected to drive the revenues further going

  • forward. ZSL has plans to invest Rs. 2000 mn to expand its ‘Wi-Fi’ wireless broadband services in five metropolitan cities

Delhi, Bengaluru, Mumbai, Hyderabad and Kolkata over the next two years. ZSL is likely to roll out the Wi-Fi service in some cities by mid-2010, which could boost its revenues in FY11. While significant upside is expected in sales, the operating profit growth is expected to be much lower at 29.6% in FY11 mainly

  • n account of higher onsite presence (65%) & relatively lower margins of BH of around 2.5-3% as compared to ZSL’s

standalone margins, which currently stand at 19.6%. We expect ZSL’s consolidated OPM to dip by 463 bps to 11% in FY11. This, along with higher interest cost & tax expense is further expected to drag ZSL’s consolidated PAT margins lower by 347 bps to 7%. PAT is expected to grow by 22.8%. At CMP of Rs. 508.5, ZSL trades at 6.6xFY11E EPS, which is at a substantial discount to its peers like Mind Tree & KPIT

  • Cummins. We feel that in the long run, BH margins could improve since the acquisition deal would enable ZSL to save costs
  • n account of offshoring contracts, sourcing of contractors from India for non-government businesses and further reduction in

non-billable staff. This is likely to improve company’s valuations going forward. Further, if ZSL’s acquisition plans this fiscal (to expand presence in e-governance) in US & Asia Pacific region by the end of FY11 materialise, then its FY11 consolidated sales & profits could be higher than our estimates. This could be a big positive trigger for the stock & the current discount in PE to its peers could narrow. Moreover, the growth in size of business due to the latest acquisition and the scope/potential of the Brainhunter acquisition could result in renewed interest in the stock and lead to rerating. Key risks include integration issues, higher tax, rising costs, risks to outsourcing, rising competition, uncertainty on scaling up and profitability of Wi-Fi initiative. Improvement in dividend payment [60% in FY10 (FV: Rs. 10) vs. 30% in FY08 & FY09], robust cash balance could further provide support to the stock price. We feel that the stock could trade at 8xFY11E EPS, which gives a price target of Rs. 612. Hence we recommend investors to buy this scrip at current levels & average it on dips in the price band of Rs. 460-475 for the above mentioned price target over the next one to two quarters.

slide-10
SLIDE 10

Retail Research

10

Quarterly Financial Performance: (Standalone)

(Rs. In Million) Particulars Q4FY10 Q4FY09 VAR [%] Q3FY10 VAR [%] (Q-o-Q) Q3FY09 VAR [%] (Y-o-Y) Q2FY10 Q1FY10 Net Sales 2118.4 1818.7 16.5 2016.5 5.1 1954.7 3.2 1909.6 1790.8 Other Income 12.7 283.2

  • 95.5

26.0

  • 51.2

90.6

  • 71.3
  • 1.4

6.7 Total Income 2131.1 2101.9 1.4 2042.5 4.3 2045.3

  • 0.1

1908.2 1797.5 Total Expenditure 1693.3 1879.1

  • 9.9

1579.7 7.2 1745.4

  • 9.5

1560.0 1463.5 Employee Expenses 999.6 1350.6

  • 26.0

1047.1

  • 4.5

1273.4

  • 17.8

1111.8 1013.0 Selling & Admin Expenses 440.6 293.1 50.3 443.1

  • 0.6

394.1 12.4 366.3 305.8 Software Dev. Cost - others 253.1 235.4 7.5 89.5 182.8 77.9 14.9 81.9 144.7 PBIDT 437.8 222.8 96.5 462.8

  • 5.4

299.9 54.3 348.2 334.0 Interest 37.0 21.2 74.5 36.5 1.4 13.7 166.4 22.0 21.4 PBDT 400.8 201.6 98.8 426.3

  • 6.0

286.2 49.0 326.2 312.6 Depreciation 82.4 63.9 29.0 76.7 7.4 46.2 66.0 67.1 58.0 PBT 318.4 137.7 131.2 349.6

  • 8.9

240.0 45.7 259.1 254.6 Tax (DT & FBT) 52.5 20.5 156.1 102.0

  • 48.5

25.1 306.4 49.8 55.7 PAT 265.9 117.2 126.9 247.6 7.4 214.9 15.2 209.3 198.9 EPS (Rs.) 16.2 7.1 126.9 15.1 7.4 13.1 15.2 12.7 12.1 Equity 164.5 164.5 0.0 164.5 0.0 164.5 0.0 164.5 164.5 Face Value 10.0 10.0 0.0 10.0 0.0 10.0 0.0 10.0 10.0 OPM (%) 20.1

  • 3.3
  • 704.2

21.7

  • 7.4

10.7 102.3 18.3 18.3 PATM (%) 12.6 6.4 94.8 12.3 2.2 11.0 11.7 11.0 11.1

(Source: Company, HDFC Sec)

Yearly Financials: (Standalone) Profit & Loss A/c

(Rs. In Million) Particulars FY08 FY09 FY10 Net Sales 6059.4 7349.4 7835.2 Other Income 65.9 489.5 43.9 Total Income 6125.3 7838.9 7879.1 Total Expenditure 5033.0 6623.3 6296.6 Employee Expenses 3739.1 4294.0 4171.5 Selling & Administrative Expenses 1034.0 1306.7 1555.9 Software Development Cost - Others 259.9 1022.6 569.2 PBIDT 1092.3 1215.6 1582.5 Interest 44.6 55.8 116.8 PBDT 1047.7 1159.8 1465.7 Depreciation 104.0 193.7 284.2 PBT 943.7 966.1 1181.5 Tax (incl. DT & FBT) 121.3 114.4 260.0 Reported PAT 822.4 851.7 921.5 Extra-ordinary Items

  • 5.0

0.0 0.0 Adjusted PAT 827.4 851.7 921.5 EPS (Rs.) 50.3 51.8 56.0 OPM (%) 16.9 9.9 19.6 PATM (%) 13.7 11.6 11.8

(Source: Company, HDFC Sec)

slide-11
SLIDE 11

Retail Research

11

Financial Estimations: (Consolidated)

Quick Estimates: (Rs. In Million) YE March FY08 FY09 FY10 FY11E Net Sales 6091 7498 9799 18040 Operating Profit 1028 716 1531 1984 Adjusted PAT 822 845 1025 1258 EPS 49.9 51.4 62.3 76.5 Equity 164.5 164.5 164.5 164.5 FV 10.0 10.0 10.0 10.0 OPM (%) 16.9 9.5 15.6 11.0 PBT (% 15.5 12.9 13.3 9.1 PAT (%) 13.5 11.3 10.5 7.0 Market Cap / Sales 1.4 1.1 0.8 0.5

(Source: Company, HDFC Sec Estimates)

Analyst: Mehernosh K. Panthaki (Mehernosh.Panthaki@hdfcsec.com)

RETAIL RESEARCH Tel: (022) 3075 3400 Fax: (022) 2496 5066 Corporate Office

HDFC Securities Limited, I Think Techno Campus, Building - B, "Alpha", Office Floor 8, Near Kanjurmarg Station, Opp. Crompton Greaves, Kanjurmarg (East), Mumbai 400 042 Phone: (022) 3075 3400 Fax: (022) 2496 5066 Website: www.hdfcsec.com Email: hdfcsecretailresearch@hdfcsec.com Disclaimer: This document has been prepared by HDFC Securities Limited and is meant for sole use by the recipient and not for circulation. This document is not to be reported or copied or made available to others. It should not be considered to be taken as an offer to sell or a solicitation to buy any security. The information contained herein is from sources believed reliable. We do not represent that it is accurate or complete and it should not be relied upon as such. We may have from time to time positions or options on, and buy and sell securities referred to herein. We may from time to time solicit from, or perform investment banking, or other services for, any company mentioned in this

  • document. This report is intended for Retail Clients only and not for any other category of clients, including, but not limited to, Institutional

Clients