
SLIDE 1
RESULTS FROM THE BO LIQUID ARGON SCINTILLATION TEST STAND AT FERMILAB
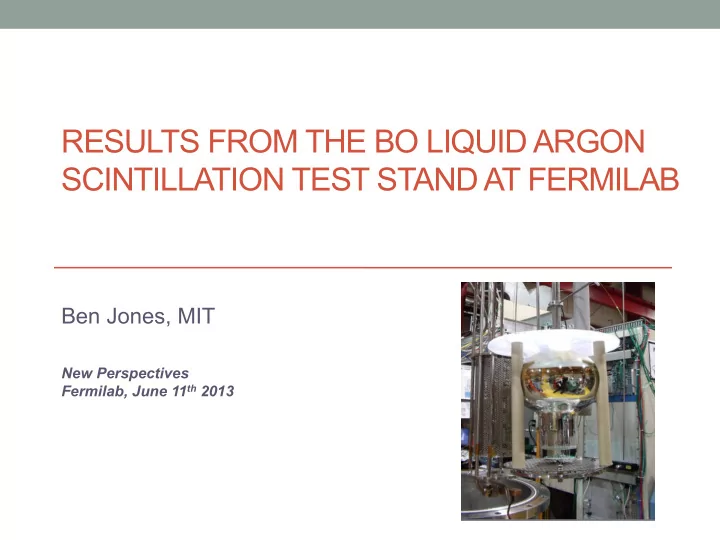
Ben Jones, MIT
New Perspectives Fermilab, June 11th 2013
RESULTS FROM THE BO LIQUID ARGON SCINTILLATION TEST STAND AT FERMILAB - - PowerPoint PPT Presentation
RESULTS FROM THE BO LIQUID ARGON SCINTILLATION TEST STAND AT FERMILAB Ben Jones, MIT New Perspectives Fermilab, June 11 th 2013 Bo VST Setup Bo Vertical Slice Test is a training ground for one slice of the MicroBooNE optical system
New Perspectives Fermilab, June 11th 2013
ground for one slice of the MicroBooNE optical system including:
studying liquid argon scintillation light uB style PMT assembly
4
Prompt peak window
ionization charge deposits.
component with t=6ns and a slow time constant with t=1500ns. Ar Ar p + Ar Ar
1Σu excimer
Ar Ar γ 6ns e Ar Ar +
p + Ar e - + Ar Ar *
3Σu excimer
1590ns
Ar Ar * Ar Ar * Ar Ar Ar Ar Ar Ar * Ar Ar γ
applications of this technique to augment TPC based particle ID in MicroBooNE.
Scintillation process Competing Excimer Dissociation Process
Pulse shape discrimination – a vital tool in dark matter detection, also useful to us!
Individual components (separated using PSD) Fit function for alpha + background
does not disturb charge drift in LArTPCs, and is difficult to remove from argon.
dissolved nitrogen are expected to be present in any large future LArTPC detector
measured in a detailed study by the WArP collaboration in small test cells
(R Acciarri et al 2010 JINST 5 P06003)
Absorption effects of N2 in LAr have not previously been measured
(late light lifetime is affected by N2 – So can’t use PSD for this study)
positions.
the liquid
equally
the nearer source.
deviate we see an N2 absorption length effect.
by other groups) separately.
!"# $%"# &'()*+',-.#/*0+#
14.5”
the liquid from a gas canister, charged to a known pressure.
known pressure we can calculate how many ppm we injected.
liquid and gas phases using LDetek8000 N2 monitor
precision from the same sample lines.
Trace nitrogen monitor Injection Canister
Kindly loaned by Jong Hee Yoo – Thanks!
!"#$%%"&'( )*+,-($.)/( %$0*$1( 2"-(#3"-,( .$)&/4,.( 5/.$)/&(
!"#"$%&'( ()*#)"( +*,(( $*'-,."/( 0/",,1/"(( 2*12"(
6,"1'(5$7,1( .$)&/4,.(8( "&4/.(
2"-(5/.$)/&$.4( 9$0*$1(5/.$)/&$.4( :$%%(%$.,( !&'/(;"<**5(
=>( =>(
34"$5()*#)"( 67/&."$.('-./&2"'( 8&'-.&/(9/&8( $/:&()*$118;( <*$118(.1=",( >(7,-2($4"$5()*#)"(?( /"#-"9()*#)"(.&(7/&."$.( )*$118(7187( <*$118(7187(.&( /"8&)"(*-/(9/&8(=&@#"( *'A(7-7-'2( <"'.()*#)"(6-'.&(/&&8;( B"#-"9()*#)"( 6>CC7,-2;(.&(7/&."$.( 7-7-'2(-'(.4"(")"'.( &9(/"21#*.&/(9*-#1/"( D&@#"( 7/",,1/"( /"21#*.&/( CEFC7,-2( 0/",,1/"( /"21#*.&/G((HC7,-2( B"#-"9()*#)"G( HC7,-2( I'J"$%&'( )*#)"(H( I'J"$%&'( )*#)"(>( <*#)"(
2"-(#3"-,( /7'4,.( 5/.$)/&(
KH(( L""A(( !"#"$.( M&(*/2&'(( N#."/(,*87#"(#-'"(
Light loss due to N2 in 8” source configuration 27ppb N2 3.7ppm N2 7.4ppm N2 15.5 ppm N2 Preliminary
Preliminary Divergence of these two lines is clear evidence for the nitrogen absorption effect!
to within 1% for each run
the precision of
measurements
assume constant and fold in variations as a systematic error
Preliminary No light loss during periods with no nitrogen injection – gives confidence in system stability, constrains
Measured Attenuation Strength: Measured Absorption Cross Section:
Preliminary
Comparison to N2 gas absorption cross section world data
Preliminary
Ray trace to understand expected light yields per percent
8” 14.5”
Ratio = Light loss at 8” Light loss at 14.5”
Our region of interest
We will measure the nitrogen absorption effect as % light loss per ppm^-1 cm^-1. First, measure the light loss ratio as a function of N2 concentration. In our region of interest the relationship should be ~linear. Absorption strength extracted by comparing the gradient of the measured line to the gradient of the line right, which gives proportionality factor for X axis scales. This factor tells us the % light loss per ppm cm of nitrogen.
5 10 15 20 25 30 35 40 45 50 55 60 65 70 5 10 15 20 25
Measured Gas Concentration (ppm) Measured Liquid Concentration (ppm)
Air Liquide Saturation Tables NIST REFPROP (Tope)
2) Measurement from liquid and gas capillaries in agreement with saturation pressure based equilibrium calculation 1) Amount of N2 in liquid agrees with amount injected to within our uncertainty of the injection volume.
!" #" $!" $#" %!" %#" !" #" $!" $#" %!" %#"
!"#$%&'#$()"*+(,-.#&/*-(0122(344+5( 0#126"#$(7%86%$(9*-&#-'"1/*-(344+5(
Single exponent power law (cosmic background) + Poisson (alpha source) Detected light spectrum – clean argon, source at 8”
Check on functional form of fits: Power law background is great. Alpha fit needs improvement (not exactly poissonian).
“Shadowing” of outer source edges leads to reduced poisson mean light yield from edge area elements This leads to an enhanced low tail of the source spectrum
Disc source kindly loaned by Adam Para – Thanks!
Now we know how the source is shadowed, we know how to fit all points.
Major improvement with new fit function. Note : no extra free parameters, since shadowing function was tuned on an independent dataset.
Alpha enriched Cosmic
Saturation
+,$-./&$)-*#%& 0#*()&%12./(%3&$)-*#%& !"#$%&$'()%$&*+,&
4&
128nm 1.18 ± 0.1 Visible photons out / UV photon in for evaporative TPB
35
36
1” 6 mm 1/8” Side view Top view
Obscured by holder
37
Baseline Less Obscured More Obscured Try a few options; System has cylindrical symmetry, so distribution in phi does not matter.
0 < r < 1.5mm : Empty 1.5 < r < 3mm : Uniform source 0 < r < 3mm : Uniform Source 0 < r < 1.5mm : Uniform source 1.5 < r < 3mm : Empty
¼ of plate area covered ¾ of plate area covered Full plate area covered
38
argon
* = First installation and test of actual MicroBooNE cryo analytics!
39