
SLIDE 1
Tyson Rupnow, Ph.D., P.E. Zhong Wu, Ph.D., P.E.
April 26, 2016
Results from LTRCs Accelerated Loading Facility Tyson Rupnow, - - PowerPoint PPT Presentation
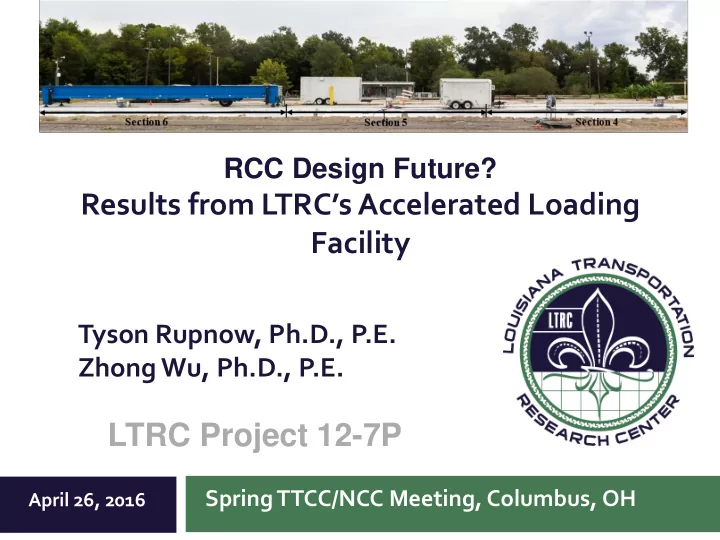
RCC Design Future? Results from LTRCs Accelerated Loading Facility Tyson Rupnow, Ph.D., P.E. Zhong Wu, Ph.D., P.E. LTRC Project 12-7P Spring TTCC/NCC Meeting, Columbus, OH April 26, 2016 Outline Background Objectives Field
April 26, 2016
Background Objectives Field construction results Preliminary load test results Conclusions
RCC for roadways started in the mid-1980’s Successful RCC projects include:
U.S. 78 near Aiken, SC
10” RCC – 1 mile 4 lane section completed in 2009
2012 Arkansas completed a section in the Fayetteville
7” RCC over a reconstructed base course 8” RCC placed as an overlay
350, 400, 450, and 500 PCY mixtures Tested for density first (Modified Proctor) Then tested for strength
Material Quantity (pcy) Cement 450 Coarse Aggregate 1521 Fine Aggregate 2017 Water 154
Density slightly lower in the bottom depth Strengths at 55 days of age Lane 1 – 5192 psi Lane 2 – 4422 psi Due to lower densities
Section Number Thickness (in) 1 9.65 2 6.05 3 4.90 4 8.01 5 6.36 6 4.10
Six full-scale RCC pavement test sections were constructed at Pavement
Facility of Louisiana Transportation Research Center (LTRC)
Section 2 Section 4 Section 3 Section 5 Section 1 Section 6
ATLaS30 Dual-tire load, 130psi Load: up to 30 kips Speed: 4~6 mph Bi-directional loading Effective length: 42-ft About 10,000 passes/day
9,000 lb 16,000 lb 20,000 lb 25,000 lb
for each load level, 22,000 lb
Typical stress and strain measured at the bottom of RCC slabs with different
thickness under APT loading
1 2 3 4 5 6 7 8 9 10 9 Kip 16 Kip 20 Kip 25 Kip
Pressure, Psi
Vertical Pressure
8+8.5RCC 6+8.5RCC 4+8.5RCC
5 10 15 20 25 30 35 40 9 Kip 16 Kip 20 Kip 25 Kip
Microstrain Longitudinal Strain
8+8.5RCC 6+8.5RCC 4+8.5RCC
5 10 15 20 25 9 kip 16 kip 20 kip 25 kip
Pressure, psi Vertical Pressure
4+8.5RCC 4+12RCC
10 20 30 40 50 60 9 kip 16 kip 20 kip 25 kip
Microstrain Longitudinal Strain
4+8.5RCC 4+12RCC
Typical stress and strain measured at the bottom of RCC slabs over different
base support under APT loading
(11.28 million equivalent ESALs), no significant damage was observed
section 6+8.5RCC to fatigue failure, the test was discontinued
Current Pavement Condition
392,500 Passes
II
Visual Distresses
Pavement Condition at the end of testing
1.75 million Passes
Pavement Condition at the end of testing
Visual Distresses
706,500 Passes
Due to relatively weaker support, an early
This section failed at about 3-million
Predicted 0.7 million ESALs to failure
Longitudinal crack along the wheel path
196,000 Passes
Longitudinal cracks Pumping and Local failure Completed now with about 19
Predicted 1.9 million
637,000 Passes
After 1,050,000 Load Repetition After 1,230,000 Load Repetition After 1,500,000 Load Repetition After 1,750,850 Load Repetition
Crack Mapping
After 390,000 Load Repetition After 480,000 Load Repetition After 560,000 Load Repetition After 706,500 Load Repetition Crack Mapping
Crack Mapping
On-going
Crack initiated at the
weakest subgrade location
Cracking pattern for
thicker section was much wider than the thinner section
Uniform subgrade
resulted in a final cracking failure covering the entire loading area for
6+8.5RCC & 4+12RCC
4+8.5RCC 6+8.5RCC 4+12RCC
Except two 8” RCC test sections, the best performer is (6”RCC + 8.5” soil cement) section, with
Rideable surface and relatively low IRI; Outstanding load carrying capacity, est. ESALs = 87.4 M; Potential to be used for heavy-loaded, medium speed
pavements;
Sections (4”RCC+8.5” soil cement) and (6”RCC+12” cement treated) also performed very well
Both can carry large amounts of heavy traffic (half axle
>20kips); Est. ESALs > 15 M
Surface IRI to be controlled during the construction Potential to be used for low-volume roads with heavy
truck traffic.
Four RCC sections failed under fatigue cracking. The observed fatigue cracks were initiated first either in the middle or at the edge of the tire print along a longitudinal direction;
The width of fatigue cracking pattern was found much wider for 6-in RCC sections (e.g. 6+8.5RCC) than that for 4-in. RCC sections
RCC-Pave fatigue models were found not suitable for the fatigue life prediction of thin RCC sections evaluated.
Two preliminary fatigue models for thin RCC pavement fatigue analysis have been developed
Will finalize the developed fatigue model Will perform cost-benefit analysis Will build a Finite element model to simulate thin-RCC pavement
The construction of RCC test lanes was a joint effort between
CAAL was instrumental in arranging industry support
Gilchrest Contractors provided the manpower and
Holcim and LaFarge provided cement Vulcan Materials provided aggregate Rollcon in Houston, TX paved the test lanes; and Cemex of Arizona setup and operated pugmill