
SLIDE 1
Department of Chemical Engineering I.I.T. Bombay, India
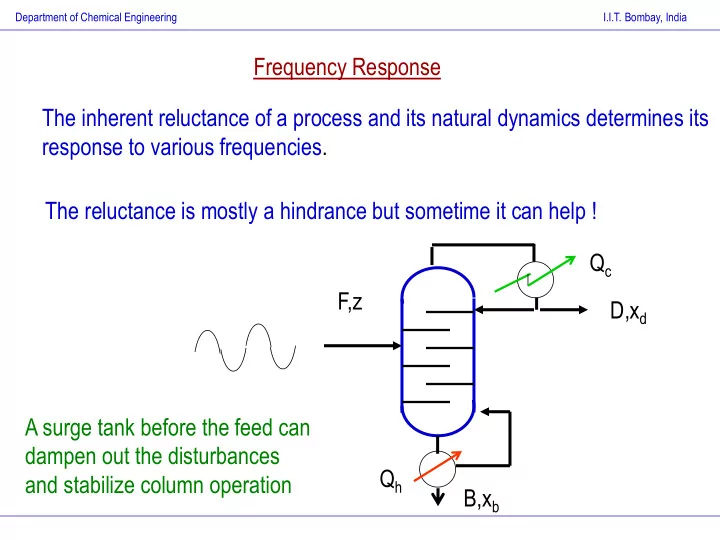
response to various frequencies. The reluctance is mostly a - - PowerPoint PPT Presentation
Department of Chemical Engineering I.I.T. Bombay, India Frequency Response The inherent reluctance of a process and its natural dynamics determines its response to various frequencies. The reluctance is mostly a hindrance but sometime it can
Department of Chemical Engineering I.I.T. Bombay, India
Department of Chemical Engineering I.I.T. Bombay, India
Department of Chemical Engineering I.I.T. Bombay, India
2 2
2 2
Department of Chemical Engineering I.I.T. Bombay, India
Real axis
b a
Department of Chemical Engineering I.I.T. Bombay, India
Department of Chemical Engineering I.I.T. Bombay, India
2 2 2 2 2 2
2 2 2 2
2 2 2 2 2 2
2 2
Department of Chemical Engineering I.I.T. Bombay, India
Department of Chemical Engineering I.I.T. Bombay, India
Department of Chemical Engineering I.I.T. Bombay, India
Department of Chemical Engineering I.I.T. Bombay, India
Department of Chemical Engineering I.I.T. Bombay, India
1 2 2