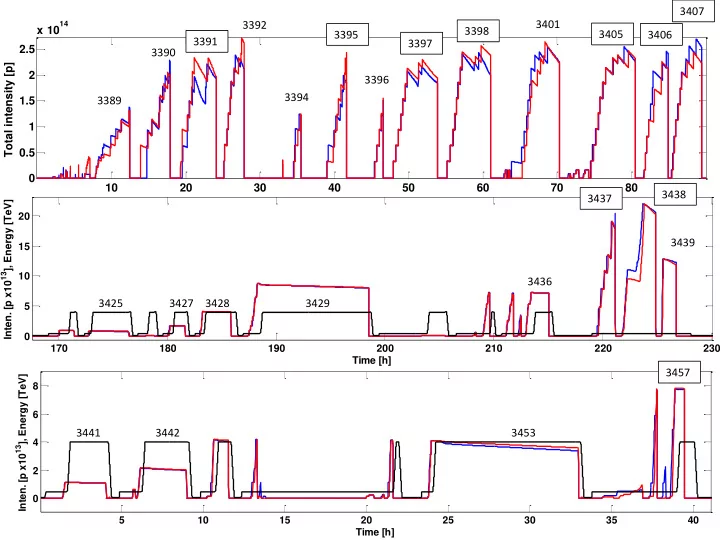
3391 3397 2.5 3390 Total intensity [p] 2 3396 3394 3389 1.5 - - PowerPoint PPT Presentation

3391
SMART_READER_LITE
LIVE PREVIEW

3391 3397 2.5 3390 Total intensity [p] 2 3396 3394 3389 1.5 - - PowerPoint PPT Presentation

3407 3392 3401 14 x 10 3398 3405 3395 3406 3391 3397 2.5 3390 Total intensity [p] 2 3396 3394 3389 1.5 1 0.5 0 10 20 30 40 50 60 70 80 3438 3437 Time [h] Inten. [p x10 13 ], Energy [TeV] 20 3439 15 10 3436 3425


slide-1
SLIDE 1

170 180 190 200 210 220 230 5 10 15 20 Time [h]

  • Inten. [p x1013], Energy [TeV]

10 20 30 40 50 60 70 80 0.5 1 1.5 2 2.5 x 10

14

Time [h] Total intensity [p]

3389 3390 3391 3392 3394 3395 3396 3397 3398 3401 3405 3406 3407

5 10 15 20 25 30 35 40 2 4 6 8 Time [h]

  • Inten. [p x1013], Energy [TeV]

3425 3427 3428 3429 3436 3441 3442 3453 3457 3437 3438 3439

slide-2
SLIDE 2

25 ns in the LHC in 2012 Overview

Scrubbing run 6 – 10 Dec 2012 MDs 12 – 15 Dec 2012 Physics run 15 – 17 Dec 2012

1) Scrubbing speed: why has the scrubbing process seemingly stopped in the LHC ? 2) Behavior of the heat load/stable phase shift with the beam energy

slide-3
SLIDE 3

Scrubbing Run Heat load in the arcs

10 20 30 40 50 60 70 80 0.5 1 1.5 2 2.5 x 10

14

Time [h] Total intensity [p] 10 20 30 40 50 60 70 80 20 40 60 Time [h] Heat load [W/hc]

Thanks to L. Tavian

slide-4
SLIDE 4

10 20 30 40 50 60 70 80 0.5 1 1.5 2 2.5 x 10

14

Time [h] Total intensity [p] 10 20 30 40 50 60 70 80 0.5 1 1.5 2 2.5 x 10

  • 13

Time [h] HL/I [W/(hc p)]

Scrubbing Run Heat load in the arcs Improvement Saturation

slide-5
SLIDE 5

Scrubbing Run Beam lifetimes Improvement Saturation

slide-6
SLIDE 6

Scrubbing Run Stable phase shifts

Thanks to J. Esteban-Müller,

  • E. Shaposhnikova

Power loss from stable phase shift (Beam1 and Beam2) Total power loss from stable phase shift Total power loss from heat load in the arcs Ratio between power losses in above graph

Beam 1 loses more power than Beam 2  consistent with worse lifetime

slide-7
SLIDE 7

Scrubbing Run Stable phase shifts

Thanks to J. Esteban-Müller,

  • E. Shaposhnikova

Information on the build up of the e-cloud from the bunch-by- bunch measurements: saturated within the first four batches Could explain better lifetime of last injected batches

slide-8
SLIDE 8

Scrubbing Run Stable phase shifts

Thanks to J. Esteban-Müller,

  • E. Shaposhnikova

Information on the build up of the e-cloud from the bunch-by- bunch measurements: still building up, not yet in saturation Could explain worse lifetime of last injected batches

slide-9
SLIDE 9

MDs at 4 TeV Heat load

5 10 15 20 25 30 35 40 45 50 2 4 6 8 Time [h]

  • Inten. [p x1013], Energy [TeV]

5 10 15 20 25 30 35 40 45 50 20 40 60 Time [h] Heat load [W/hc]

Thanks to L. Tavian

Heat load enhanced and nearly flat at 4 TeV !!!!

slide-10
SLIDE 10

2 4 6 8

  • Inten. [p x1013], Energy [TeV]

20 40 60 Heat load [W/hc] 800 bunches@4 TeV for 8h Electron dose of about 2.4 x 10⁻³ C/mm2 (estimated by simulations)

Fill 3429

20 25 30 Time [h] 20 25 30 Time [h]

10

  • 8

10

  • 6

10

  • 4

10

  • 2

10 1 1.2 1.4 1.6 1.8 2 SEYmax Dose [C/mm2]

  • C. Yin Vallgren, Ph.D. thesis,

CERN-THESIS-2011-063 (2011)

slide-11
SLIDE 11

2 4 6 8

  • Inten. [p x1013], Energy [TeV]

20 40 60 Heat load [W/hc] 800 bunches@4 TeV for 8h Electron dose of about 2.4 x 10⁻³ C/mm2 (estimated by simulations)

Fill 3429

20 25 30 Time [h] 20 25 30 Time [h]

THE CHEMICAL ORIGIN OF SEY AT TECHNICAL SURFACES

  • R. Larciprete, et al., Proceedings of ECLOUD12

E-cloud threshold in dipoles

slide-12
SLIDE 12

Scrubbing Run Stable phase shifts

Thanks to J. Esteban-Müller,

  • E. Shaposhnikova

Power loss from stable phase shift (Beam1 and Beam2) Total power loss from stable phase shift Total power loss from heat load in the arcs Ratio between power losses in above graph

Transverse emittances (from BSRT) were not much degraded for this fill

slide-13
SLIDE 13

Scrubbing Run Stable phase shifts

Thanks to J. Esteban-Müller,

  • E. Shaposhnikova
slide-14
SLIDE 14

Scrubbing Run Stable phase shifts

Thanks to J. Esteban-Müller,

  • E. Shaposhnikova
slide-15
SLIDE 15

Scrubbing Run Stable phase shifts

Thanks to J. Esteban-Müller,

  • E. Shaposhnikova

Power loss from stable phase shift (Beam1 and Beam2) Total power loss from stable phase shift Total power loss from heat load in the arcs Ratio between power losses in above graph

Transverse emittances (from luminosity) were degraded for this fill

slide-16
SLIDE 16

Scrubbing Run Stable phase shifts

Thanks to J. Esteban-Müller,

  • E. Shaposhnikova
slide-17
SLIDE 17

Scrubbing Run Stable phase shifts

Thanks to J. Esteban-Müller,

  • E. Shaposhnikova
slide-18
SLIDE 18

Scrubbing Run Stable phase shifts

Thanks to J. Esteban-Müller,

  • E. Shaposhnikova

Fill 3457 has about the same number of bunches as Fill 3429 (but BCMS)

slide-19
SLIDE 19

Scrubbing Run Stable phase shifts

Thanks to J. Esteban-Müller,

  • E. Shaposhnikova
slide-20
SLIDE 20

0.00 0.50 1.00 1.50 2.00 2.50 3380 3390 3400 3410 3420 3430 3440 3450 3460 Ratio Fill number

(Power loss from phase shift)/(Heat load)

Flat bottom Flat top

Data only from end of the fills…

slide-21
SLIDE 21
  • Electron cloud in the arcs elsewhere than in the

dipoles?

→ Quadrupoles, multipoles

  • Modeling of the Secondary Emission process

→ What happens at low energies? → Re-diffused electrons

  • Scrubbing behaviour

→ Cold surfaces?

 Lab measurements suggest similar scrubbing curves  The COLDEX experience  slow decay of heat load …

→ Scrubbing relies on the presence of C

 Do we have formation of a C layer in the LHC BS ?

21

Why scrubbing stops

slide-22
SLIDE 22

1 1.5 2 2.5 10

  • 4

10

  • 2

10 10

2

10

4

SEY Heat load [W/hc/beam] Dipole Quadrupole Drift 22

→ Contribution from quads?

 Cells composed of 80% dipoles, but also 6% quadrupole + 14% drift & multipoles  SEY thresholds are different in dipole/drift (1.45) or quadrupole (1.2)  Electron cloud in dipoles is dominant (1-2 orders of magnitude) as long as dmax > 1.5 in dipole chambers  But now quadrupoles (and multipoles?) could be dominant …

→ Consistent with

 Saturation of scrubbing process (scrubbing curve becomes flat for SEY below 1.3)  Long memory between trains  Stand-alones

slide-23
SLIDE 23

Standalones (SAM) – examples

slide-24
SLIDE 24

Standalones (SAM)

slide-25
SLIDE 25

Standalones (SAM)

slide-26
SLIDE 26

Standalones (SAM)

slide-27
SLIDE 27

Standalones (SAM)

Heat loads in D3 and arcs exhibit a sharp increase on the ramp, heat load in the quads seems unaffected

slide-28
SLIDE 28
  • Effect of the beam size?

→ Bunch length is about constant, transverse sizes decrease → Simulations seem not to confirm effect of transverse size

  • Dependence of surface properties on magnetic field

→ SEY would affect multipacting

  • Photoelectrons

→ Would only affect seed electrons and the time to reach saturation → No threshold effect observed at around 2 TeV → Dipole edge effects cause photoelectrons already at 450 GeV?

  • Probably seen only close to threshold (also based on SPS

experience, though with shortening bunches)

28

Energy dependence

slide-29
SLIDE 29

29

Usual Cos Flat

Influence of low energy electrons

slide-30
SLIDE 30

30

1 1.1 1.2 1.3 1.4 1.5 1.6 1.7 1.8 10

  • 6

10

  • 4

10

  • 2

10 10

2

SEY Scrubbing dose (50eV) [mA/m] 72bpi - cos low en. 288bpi - cos low en. 72bpi - usual mod. 288bpi - usual mod. 1 1.1 1.2 1.3 1.4 1.5 1.6 1.7 1.8 10

  • 4

10

  • 3

10

  • 2

10

  • 1

10 10

1

10

2

SEY Scrubbing dose (50eV) [mA/m] 72bpi - flat low. en. 288bpi - flat low. en. 72bpi - usual mod. 288bpi - usual mod.

slide-31
SLIDE 31

Scrubbing Run Stable phase shifts

Thanks to J. Esteban-Müller,

  • E. Shaposhnikova