
SLIDE 1
3/18/2012 1
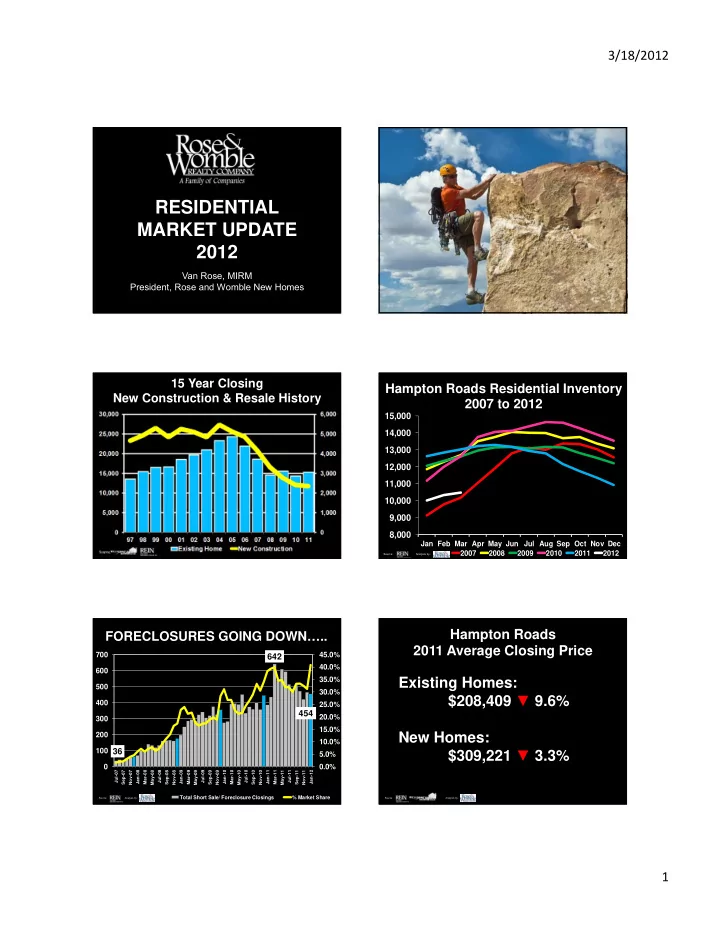
RESIDENTIAL MARKET UPDATE 2012
Van Rose, MIRM President, Rose and Womble New Homes
15 Year Closing New Construction & Resale History
Source:
Hampton Roads Residential Inventory 2007 to 2012
8,000 9,000 10,000 11,000 12,000 13,000 14,000 15,000
Jan Feb Mar Apr May Jun Jul Aug Sep Oct Nov Dec 2007 2008 2009 2010 2011 2012
Source: Analysis by:
FORECLOSURES GOING DOWN…..
Source: Analysis by:
0.0% 5.0% 10.0% 15.0% 20.0% 25.0% 30.0% 35.0% 40.0% 45.0% 100 200 300 400 500 600 700
Jul-07 Sep-07 Nov-07 Jan-08 Mar-08 May-08 Jul-08 Sep-08 Nov-08 Jan-09 Mar-09 May-09 Jul-09 Sep-09 Nov-09 Jan-10 Mar-10 May-10 Jul-10 Sep-10 Nov-10 Jan-11 Mar-11 May-11 Jul-11 Sep-11 Nov-11 Jan-12
Total Short Sale/ Foreclosure Closings % Market Share
36 642 454
Hampton Roads 2011 Average Closing Price
Source: Analysis by: