
1
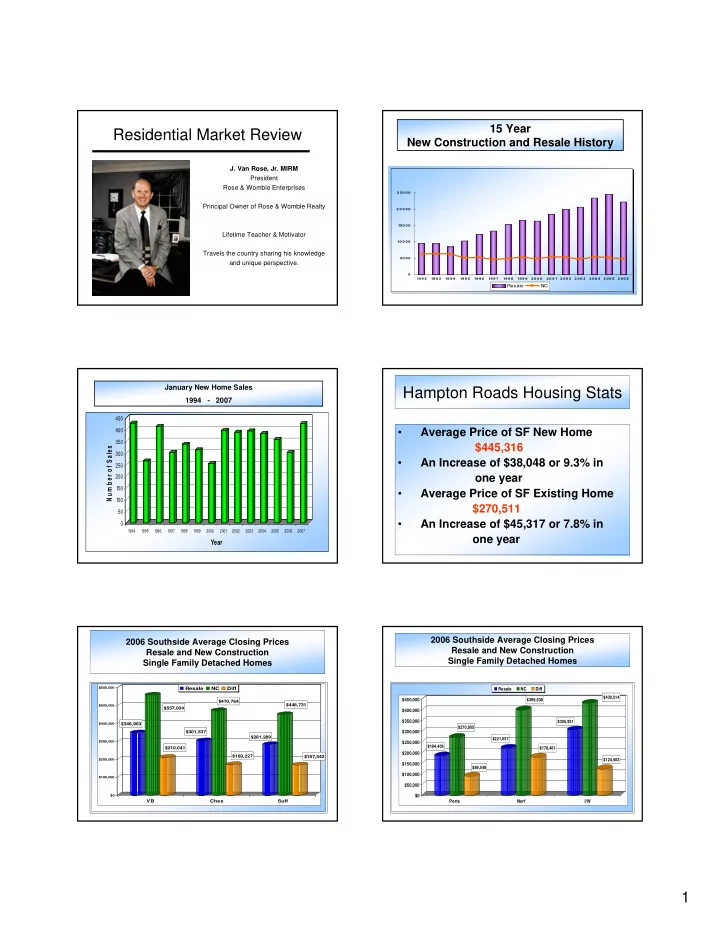
Residential Market Review
- J. Van Rose, Jr. MIRM
President Rose & Womble Enterprises Principal Owner of Rose & Womble Realty Lifetime Teacher & Motivator Travels the country sharing his knowledge and unique perspective.
15 Year New Construction and Resale History
50 0 0 10 0 0 0 150 0 0 2 0 0 0 0 2 50 0 0 19 9 2 19 9 3 19 9 4 19 9 5 19 9 6 19 9 7 19 9 8 19 9 9 2 0 0 0 2 0 0 1 2 0 0 2 2 0 0 3 2 0 0 4 2 0 0 5 2 0 0 6
Resale NC
January New Home Sales 1994 - 2007
50 1 00 1 50 200 250 300 350 400 450
N u m b e r o f S a le s
1994 1995 1996 1997 1998 1999 2000 2001 2002 2003 2004 2005 2006 2007
Year
Hampton Roads Housing Stats
- Average Price of SF New Home
$445,316
- An Increase of $38,048 or 9.3% in
- ne year
- Average Price of SF Existing Home
$270,511
- An Increase of $45,317 or 7.8% in
- ne year
$346,963 $557,004 $210,041 $301,537 $470,764 $169,227 $281,289 $448,731 $167,442
$0 $100,000 $200,000 $300,000 $400,000 $500,000 $600,000
VB Ches Suff Resale NC Diff
2006 Southside Average Closing Prices Resale and New Construction Single Family Detached Homes
$184,406 $270,955 $89,549 $221,057 $399,538 $178,481 $305,931 $430,514 $124,583 $0 $50,000 $100,000 $150,000 $200,000 $250,000 $300,000 $350,000 $400,000 $450,000 Ports Norf I/W Resale NC Diff
2006 Southside Average Closing Prices Resale and New Construction Single Family Detached Homes