1 Southside Single - Family Detached Homes Market Share 1994 vs. - - PDF document

1
SMART_READER_LITE
LIVE PREVIEW

1 Southside Single - Family Detached Homes Market Share 1994 vs. - - PDF document

Old Dominion University Old Dominion University Hampton Roads Real Estate Hampton Roads Real Estate Residential Market Review Residential Market Review Market Review and Forecast Market Review and Forecast 2006 2006 J. Van Rose, Jr. MIRM


slide-1
SLIDE 1

1

Residential Review Residential Review – – J.V. Rose, Jr. J.V. Rose, Jr. Old Dominion University Old Dominion University Hampton Roads Real Estate Hampton Roads Real Estate Market Review and Forecast Market Review and Forecast 2006 2006

Presented by: E.V. Williams Center for Real Estate and Economic Development

Residential Market Review Residential Market Review

  • J. Van Rose, Jr. MIRM

President Rose & Womble Enterprises Principal Owner of Rose & Womble Realty 2004 Rose & Womble Sold 7,000 Homes Equaling $ 1 Billion in Volume Lifetime Teacher & Motivator Travels the country sharing his knowledge and unique perspective.

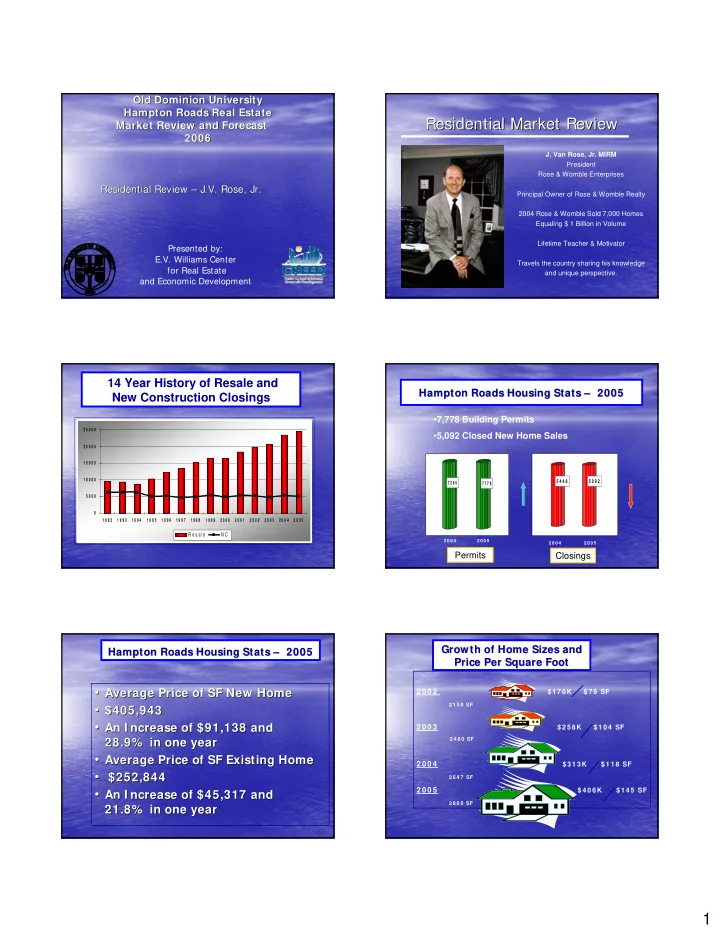
14 Year History of Resale and New Construction Closings

5 0 0 0 1 0 0 0 0 1 5 0 0 0 2 0 0 0 0 2 5 0 0 0 1 9 9 2 1 9 9 3 1 9 9 4 1 9 9 5 1 9 9 6 1 9 9 7 1 9 9 8 1 9 9 9 2 0 0 0 2 0 0 1 2 0 0 2 2 0 0 3 2 0 0 4 2 0 0 5

R e s a le N C

Hampton Roads Housing Stats Hampton Roads Housing Stats – – 2005 2005

Permits Closings

2 0 0 4 2 0 0 5 2 0 0 4 2 0 0 5 5 4 4 8 5 0 9 2

7 2 6 5 7 7 7 8

  • 7,778 Building Permits
  • 5,092 Closed New Home Sales
  • Average Price of SF New Home

Average Price of SF New Home

  • $405,943

$405,943

  • An I ncrease of $91,138 and

An I ncrease of $91,138 and 28.9% in one year 28.9% in one year

  • Average Price of SF Existing Home

Average Price of SF Existing Home

  • $252,844

$252,844

  • An I ncrease of $45,317 and

An I ncrease of $45,317 and 21.8% in one year 21.8% in one year

Hampton Roads Housing Stats Hampton Roads Housing Stats – – 2005 2005 Growth of Home Sizes and Growth of Home Sizes and Price Per Square Foot Price Per Square Foot

2 0 02

$17 0 K $7 9 SF

2 1 5 0 SF

2 0 03

$ 2 58 K $1 04 SF

2 4 8 0 SF

2 0 04

$ 31 3K $ 1 18 SF

2 6 4 7 SF

2 0 05

$4 0 6K $ 145 SF

2 8 0 0 SF

slide-2
SLIDE 2

2

Market Share 1994 vs. 2005 Market Share 1994 vs. 2005

2005

Resale Resale

64% 36% 18% 82% NC – 3 6 % RESALE - 6 4 % NC – 1 7 % RESALE – 8 3 %

1 99 4 2 00 5

$332,161 $473,205 $141,044 $280,078 $444,168 $164,090 $259,341 $390,187 $130,846 $0 $50,000 $100,000 $150,000 $200,000 $250,000 $300,000 $350,000 $400,000 $450,000 $500,000 VB Ches Suff Resale NC Diff

Southside Single - Family Detached Homes Resale vs. New Construction Average Closing Prices for 2005

$159,485 $300,660 $141,175 $203,738 $344,739 $141,001 $292,667 $416,734 $124,067 $0 $50,000 $100,000 $150,000 $200,000 $250,000 $300,000 $350,000 $400,000 $450,000 Ports Norf I/W Resale NC Diff

Southside Single - Family Detached Homes Resale vs. New Construction Average Closing Prices for 2005

$171,584 $298,914 $127,330 $194,880 $340,897 $146,017 $324,992 $390,523 $65,531 $0 $50,000 $100,000 $150,000 $200,000 $250,000 $300,000 $350,000 $400,000 Hamp NN YC Resale NC Diff

Peninsula Single - Family Detached Homes Resale vs. New Construction Average Closing Prices for 2005

$368,816 $390,212 $21,396 $384,978 $261,559 ($123,419) ($150,000) ($50,000) $50,000 $150,000 $250,000 $350,000 $450,000

JCC WMSB Resale NC Diff

Peninsula Single – Family Detached Homes Resale vs. New Construction Average Closing Prices for 2005

Average Consumer Lot Costs Average Consumer Lot Costs Chesapeake Chesapeake

$ 7 22 ,59 5 $ 5 39 ,73 3 $ 7 89 ,00 0 $ 6 78 ,46 1

  • Edinburgh - $275,000
  • Ruth’s Glen - $250,000
  • Emerald Forest - $285,347
  • English Oaks - $178,778

Land Cost = 3 8% Land Cost = 4 7% Land Cost = 3 6% Land Cost = 2 6%

slide-3
SLIDE 3

3

Average Consumer Lot Costs Average Consumer Lot Costs Suffolk Suffolk

$ 6 12 ,37 2 $ 4 44 ,07 8 $ 6 76 ,55 7

  • Governors Pointe - $182,000
  • Nansemond River Estates -

$ 141,825

  • The Riverfront - $368,505

Land Cost = 3 0% Land Cost = 3 1% Land Cost = 5 4%

Average Consumer Lot Costs Average Consumer Lot Costs Virginia Beach Virginia Beach

$ 7 13 ,83 7 $ 8 20 ,08 3 $ 7 20 ,00 0* $ 6 94 ,60 4

Lago Mar – $211,690 Thoroughgood– $345,000 Victoria Park – $345,000 Indian River Plantation - $281,618

*Estimated Selling Price

Land Cost = 4 3% Land Cost = 4 2% Land Cost = 4 8% Land Cost = 4 1%

Average Consumer Lot Costs Average Consumer Lot Costs James City County James City County

$ 4 59 ,70 8 $ 5 63 ,99 9 $ 5 78 ,80 2 $ 5 24 ,90 2

Lake Powell Pointe – $166,201 Governors Land– $152,812 Fords Colony – $170,073 Landfall - $153,500

Land Cost = 3 6% Land Cost = 2 9% Land Cost = 2 9% Land Cost = 2 9%

Average Consumer Lot Costs Average Consumer Lot Costs Hampton, Newport News, York Hampton, Newport News, York County, Williamsburg County, Williamsburg

$ 4 62 ,20 0 $ 4 07 ,94 0 $ 4 49 ,30 0 $ 9 58 ,40 0

H Howe Farms – $94,667 N Port Warwick – $159,724 Y Quartermarsh Est – $110,000 W Holly Hills - $385,106

Land Cost = 2 4% Land Cost = 4 0% Land Cost = 2 0 .4 % Land Cost = 2 9%

  • 1. Cautiously Optimistic

Residential Housing Residential Housing Forecast Forecast

RESI DENTI AL HOUSI NG RESI DENTI AL HOUSI NG FORECAST FORECAST REASONS:

  • 1. Hampton Roads Economics
slide-4
SLIDE 4

4

Hampton Roads Economic Stats Hampton Roads Economic Stats 2005 2005

  • The area

The area’ ’s economy has outperformed the s economy has outperformed the country country’ ’s for the past s for the past 5

5 years

years

  • The port

The port’ ’s growth and tourism provide a buffer s growth and tourism provide a buffer to military cutbacks to military cutbacks

  • Median Family I ncome

Median Family I ncome National Average National Average $ 57,511 $ 57,511 Virginia Beach Virginia Beach $ 61,230 $ 61,230 Chesapeake Chesapeake $ 58,701 $ 58,701 Hampton Hampton $ 46,110 $ 46,110 James City County James City County $ 66,171 $ 66,171

  • Average MSA Military Pay $ 52,600

Average MSA Military Pay $ 52,600

  • More than 53,000 Retired Military in HR

More than 53,000 Retired Military in HR

RESI DENTI AL HOUSI NG RESI DENTI AL HOUSI NG FORECAST FORECAST REASONS:

  • 2. Hampton Roads Housing Demand

Percent of Households That Purchased A Home in 2005 Compared To The Total Number of Households In The MSA

C h a r l o t t e N C M S A H a m p t o n R o a d s M S A

Total Closings = 38,803 12.8 % of HH Total Households = 300,800 Total Closings = 29,390 4.9 % of HH Total Households = 587,975 R a l e i g h /D u r h a m M S A Total Closings = 43,416 8.1 % of HH Total Households = 535,200

RESI DENTI AL HOUSI NG RESI DENTI AL HOUSI NG FORECAST FORECAST REASONS:

  • 3. Hampton Roads Housing Supply

Number of Homes Listed in December 1998-2005 and January 2006

8 5 8 2 6 9 0 2 6 4 4 9 5 2 0 0 4 0 8 2 2 9 2 5 2 7 6 4 2 8 0 9 5 7 3 2

2 0 0 0 4 0 0 0 6 0 0 0 8 0 0 0 1 0 0 0 0

1 9 9 8 1 9 9 9 2 0 0 0 2 0 0 1 2 0 0 2 2 0 0 3 2 0 0 4 2 0 0 5 2 0 0 6

RESI DENTI AL HOUSI NG RESI DENTI AL HOUSI NG FORECAST FORECAST REASONS:

  • 4. Effects of Interest Rates

(Mortgage Instruments)

slide-5
SLIDE 5

5

I nterest Rate Affect On Housing Affordability I nterest Rate Affect On Housing Affordability

1999 2000 2001 2002 2003 2004 2005 MI $39,704 $42,448 $51,000 $53,900 $56,302 $56,624 $59,100 IR 8.2% 7.3% 7.3% 5.5% 5.25% 6.0% 6.125%

= = = = = = = TM $154,000 $173,000 $210,000 $260,000 $300,000 $275,000

$300,000

With Down Payment

$400,000

Interest Only

$425,000

Interest Only With Down Payment

$525,000

RESI DENTI AL HOUSI NG RESI DENTI AL HOUSI NG FORECAST FORECAST REASONS:

  • 5. Military Influence

Defense Spending I n Billions Defense Spending I n Billions 1990 1990 -

  • 2006

2006

4 1 9 .3 4 1 7 3 7 9 .9 3 5 5 .1 3 2 9 2 9 1 2 2 1 2 1 9 2 0 3 2 1 8 2 2 3 2 3 0 2 3 8 2 5 8 2 7 0 2 9 5 2 9 8

50 100 150 200 250 300 350 400

1990 1991 1992 1993 1994 1995 1996 1997 1998 1999 2000 2001 2002 2003 2004 2005 2006

New Construction Closings By Price Points 2003, 2004, 2005

500 1000 1500 2000 <200 K 200-290K 300-390K 400-490K 500-590K 600-690K 700K +

2003 2004 2005