
SLIDE 1
An introduction to WS 2018/2019
- Dr. Sonja Grath
- Dr. Eliza Argyridou
Special thanks to:
- Dr. Benedikt Holtmann for sharing slides for this lecture
Rearranging and manipulating data
2
What you should know after day 5
Rearranging and manipulating data
- Reshaping data
- Combining data sets
- Making new variables
- Subsetting data
- Summarizing data
We will work with two particular packages:
- tidyr
- dplyr
Remember: What do we have to do before we can work with a package in R? (2 things)
3
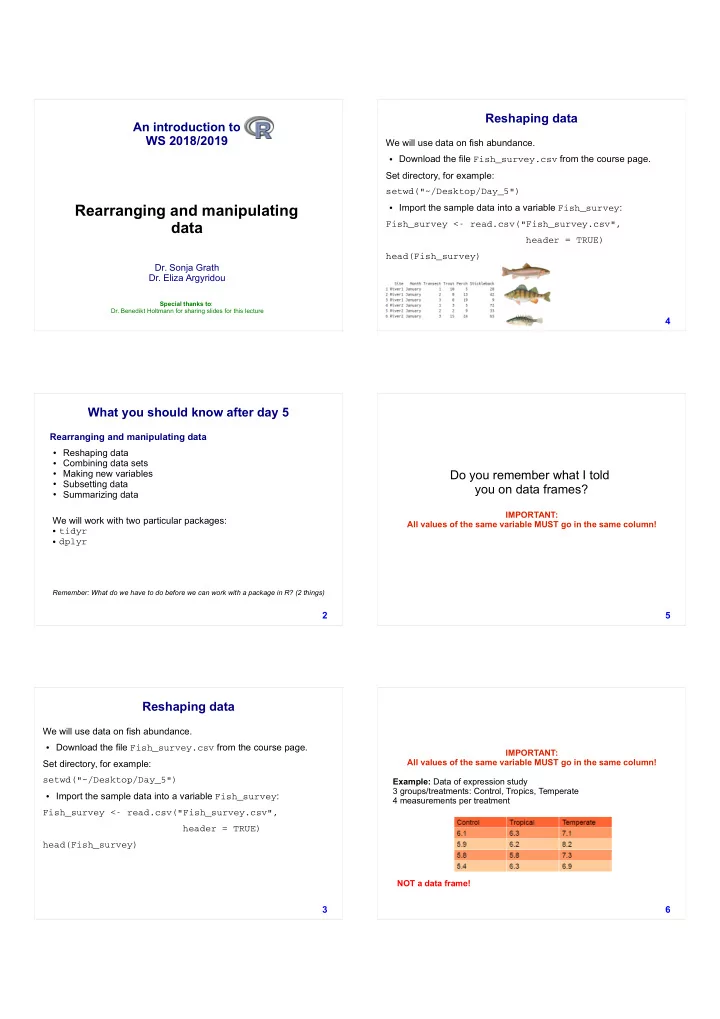
Reshaping data
We will use data on fish abundance.
- Download the file Fish_survey.csv from the course page.
Set directory, for example: setwd("~/Desktop/Day_5")
- Import the sample data into a variable Fish_survey:
Fish_survey <- read.csv("Fish_survey.csv", header = TRUE) head(Fish_survey) 4
Reshaping data
We will use data on fish abundance.
- Download the file Fish_survey.csv from the course page.
Set directory, for example: setwd("~/Desktop/Day_5")
- Import the sample data into a variable Fish_survey: