representing the w orld around us
play

Representing the W orld Around Us Mapping the W orlds Photos: pp g - PDF document

Representing the W orld Around Us Mapping the W orlds Photos: pp g Collective Perception Daniel Huttenlocher Joint w ork Lars Backstrom , David Crandall, [ Milgram72] Jon Kleinberg and Yunpeng Li 2 Collective Perception and Mental Maps


  1. Representing the W orld Around Us Mapping the W orld’s Photos: pp g Collective Perception Daniel Huttenlocher Joint w ork Lars Backstrom , David Crandall, [ Milgram72] Jon Kleinberg and Yunpeng Li 2 Collective Perception and Mental Maps Experim ents: Hand-Draw n Maps � 218 subjects each draw map of Paris � Total of 4132 elements in maps � Hand code � Hand code elements � Tabulate commonly occurring ones [ Milgram76] [ Milgram76] 3 4 
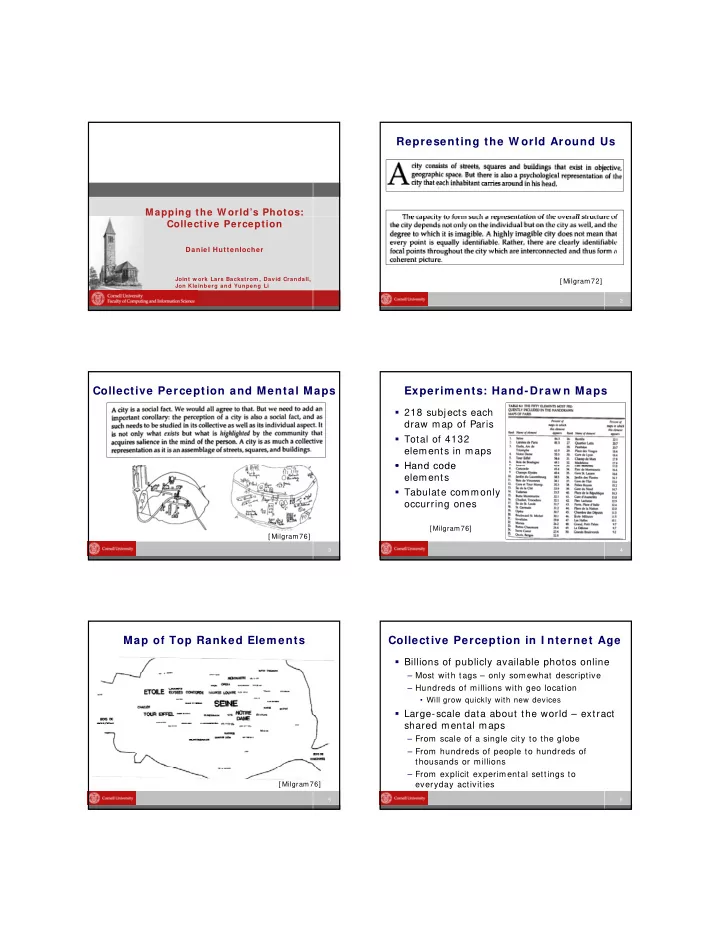
Map of Top Ranked Elem ents Collective Perception in I nternet Age � Billions of publicly available photos online – Most with tags – only somewhat descriptive – Hundreds of millions with geo location • Will grow quickly with new devices � Large-scale data about the world – extract Large scale data about the world extract shared mental maps – From scale of a single city to the globe – From hundreds of people to hundreds of thousands or millions – From explicit experimental settings to everyday activities [ Milgram76] 5 6

  2. Photo Sharing W eb Sites Analogy to W eb Search � Rich metadata � Techniques for organizing collections of Web documents exploit both link structure – Tags, geo-location, photographer and content analysis [ Page99] [ Kleinberg99] – Camera data: time/ date stamp, focal length, shutter speed, camera model, … – Collective understanding, “votes” on importance – Relationships between users and photos: p p � Photo sharing sites also have connective Photo sharing sites also have connective favorites, contact lists, … structure provided by many people – Photos taken nearby in space (and time) – Stream of photos by given photographer – Contacts, friendships between photographers � Combine with text and image content 7 8 Structure in Photo Collections Geo Tagging � Clustering/ modeling using geo-tags, text � Photos tagged with tags, image features, social network geographic info – [ Ahern07] [ Golder08] [ Jaffe06] [ Kennedy08] latitude and longitude [ Lerman07] [ Marlow06] [ Quack08] – GUI, GPS and radio � Photos taken nearby often related but far � Building and annotating maps [ Grabler08] from guaranteed – e.g., Independence Hall [ Kennedy08] [ Google Sketchup3d] � Geometric structure [ Schaffalitzky02] [ Snavely06,07] [ Microsoft Photosynth] 9 10 Latent Structure in Geo Tags Outline of Rem ainder of Talk � Restrict number of photos per photographer � Automatically finding and describing important places – “compact structure” � Spatial distribution reflects relatedness – Geolocation, text and image content – Use to find and characterize important elements � Application: automatically generated maps of mental map – “Collective perception” p p – Highlight and characterize important elements � Modeling locations and classifying spatial location of unlabeled images – Many locations, large training and test sets, temporal photostream � Summary and discussion 11 12

  3. Finding I m portant Locations Mean Shift Clustering � Natural scales of interest (“octaves”) � Simple non-parametric procedure for estimating peaks in distribution [ Comaniciu02] – 100km city/ metro area, 10km town, 1km neighborhood, 100m landmark 1. initialize kernel (e.g., disc) to some position 2. compute centroid of samples inside the disc � Want to discover locations automatically at 3. move center of disc to centroid one or more spatial scales p 4 stop if converged otherwise go to step 2 4. stop if converged, otherwise go to step 2 – Think of geo-tags as samples from unknown distribution whose modes we want to estimate at certain scales � Mean-shift procedure for mode estimation – Fixed-scale clustering, rather than k-means or agglomerative methods 13 14 Sam ple Clustering Result Representative Text Tags � Text tags that are characteristic of a given � Top 100 clusters in North America at spatial region 50km radius – from ~ 35M photos globally – Score tags according to likelihood in region versus baseline occurrence – Limit any single user’s contribution in a region – Consider tags that occur for at least some fraction of photos in region (e.g., 5% ) – Similar approaches in [ Ahern07] [ Kennedy08] � Top scoring tags ordered by likelihood 15 16 Tags for Top 1 0 0 km Radius Clusters Clusters at Multiple Geo Scales � Cities and metropolitan areas form natural peaks at 100km radius – From large areas like London, Paris and LA to small areas such as Ithaca and Iowa City � Landmarks often correspond to peaks at p p approximately 100m radius – Buildings such as St. Paul’s Cathedral, places such as Rockefeller Plaza or Trafalgar Square � Spatial hierarchy – Use landmark peaks within a city peak to describe the city (similarly for neighborhoods) 17 18

  4. Top Landm arks ( City and Global) Saliency of a City’s Landm arks � Simple measure 19 20 Representative I m ages Representative I m ages ( 2 ) � Finding visual characterizations of clusters � Related work on clustering textual and visual features [ Kennedy08] – Harder than selecting high likelihood text tags – Similar images primarily when taken at nearly – Using 100k photos of San Francisco and hand- selected landmarks, not that scalable the same place – 100m scale • Though some characteristic images at city scale – Others have used mix of content and geo, we too such as NYC yellow cabs, London buses argue for separating – Similar images are generally a relatively small percentage of all images in a spatial cluster • E.g., random photos of I ndependence Hall vs. canonical view such as full facade 21 22 Representative I m ages ( 3 ) I m age Sim ilarity Graph in Geo Cluster � Highly-photographed thing in geo cluster – Each photo is “vote” for importance � Build an image similarity graph – Measure similarity between pairs of photos using local interest point descriptors – Nodes represent images, edge weights represent similarities � Find highly-connected components in the image similarity graph – Using spectral clustering (e.g., [ Shi00] ) � Select high degree node in component 24 23

  5. Measuring I m age Sim ilarity Creating Shared Mental Maps � Use SIFT locally invariant interest point � We now have automatic techniques for descriptors [ Lowe04] – Finding highly-photographed spatial regions, at multiple scales – Points that are stable across image transformations – Finding representative textual tags (e.g. corners) – Finding representative images at landmark scale – Compute invariant descriptor � Use to create labeled maps of “what’s for each interest point important” completely automatically – ~ 1000 interest points per – City and landmark scales (100km and 100m) image, 128-dimensional descriptors – From ~ 35M geo-tagged photos on Flickr, � To compare 2 images, count “matching” downloaded via API, medium res. (~ 500 x 350) points – descriptors highly similar � Computation on 50-node Hadoop cluster 25 26 Exam ple: North Am erica Exam ple: Europe 27 28 Exam ple: South Am erica Exam ple: Southeast Asia 29 30

  6. Exam ple: UK and I reland Exam ple: Landm arks in Manhattan 31 32 Exam ple: Landm arks in Paris Exam ple: Landm arks in DC 33 34 Exam ple: Landm arks in London I nferring Spatial Location � Inverse problem: inferring location given images (possibly also text tags) � [ Milgram76] studied how people do – Where place photos in their “mental map” � [ Hays08] geo-locate images from visual [ y ] g g features – estimate lat-long – Nearest-neighbor search on “training” dataset of 6 million images • Localize 16% of photos within 200km • Small test set of 237 hand-selected images – Similar approach in [ Tsai05] for 1k images and 10 landmarks 35 36

  7. Location: Landm ark Classification Classifying Landm arks � Our approach is motivated by idea of � Given a photo known to be taken at one of mental map – saliency and importance several landmarks, identify correct one – Using svm_multiclass [ Tsochantaridis05] – Localize key places rather than trying to place any image in lat-long coordinates � Textual and visual features based on vector � Consider small numbers of identifiable space models p locations in a given city and in the world – Each text tag with > 3 occurrences a dimension – Codebook of 1-10k VQ SIFT descriptors [ Csurka04] [Milgram76] 37 38 Classification Experim ents Landm ark Classification Results � Learn n landmarks, classify disjoint test set – Between 10 and 500 landmarks – At least hundreds of training and test images per landmark – One person’s photos only in training or in test � Landmark recognition more general than specific object recognition (e.g., Trafalgar) � Random baseline of 1/ n – Restrict to same number of photos for each landmark in given experiment for comparison – Similarly significant if use true unequal counts 39 40 Photo Sequences Structured Output for Sequences � Photos nearby in time for a particular � Classify sequence of photos in terms of photographer what landmarks taken in succession – Highly related location but often quite different – Use neighbors as context for given photo, i.e., image content (and text tags) score single photo not entire sequence � Use svm struct – Exploit to improve classification results _ • I nclude features from photos within 15 minutes – For predicting structured outputs, reduces to svm_multiclass for length 1 sequences – Viterbi-style decoding/ learning � Strength of temporal relations based on time and distance (known for training) 41 42

Download Presentation
Download Policy: The content available on the website is offered to you 'AS IS' for your personal information and use only. It cannot be commercialized, licensed, or distributed on other websites without prior consent from the author. To download a presentation, simply click this link. If you encounter any difficulties during the download process, it's possible that the publisher has removed the file from their server.

Recommend


More recommend