
SLIDE 1
PD Dr Menno Pruijm University Hospital Lausanne Switzerland Nottingham, October 2019
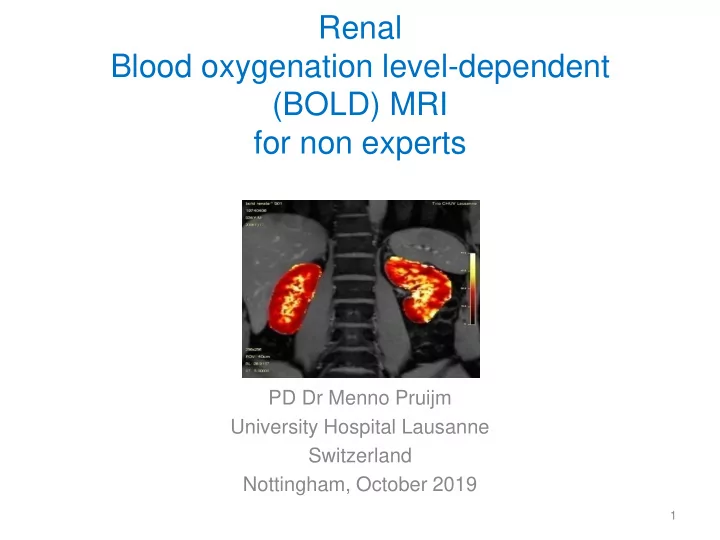
Renal Blood oxygenation level-dependent (BOLD) MRI for non experts
1
Renal Blood oxygenation level-dependent (BOLD) MRI for non experts - - PowerPoint PPT Presentation
Renal Blood oxygenation level-dependent (BOLD) MRI for non experts PD Dr Menno Pruijm University Hospital Lausanne Switzerland Nottingham, October 2019 1 Conflicts of Interest: Travel fees from: Servier, Amgen, Bbraun, Astellas
PD Dr Menno Pruijm University Hospital Lausanne Switzerland Nottingham, October 2019
1
2
3
Rodriguez-Roisin R, Int Care Med 2005. Brezis, Rosen, NEJM 1995
Anatom ical and P hysiologic Features of the R enal C ortex and M edu lla Brezis M , R osen S. 1995 N E JM ; 332:647
4
pO2 % saturated Hb
Fine, Norman, KI 1998
5
6
7
BOLD-effect explained by Prof Michael Lipton, Einstein University, Bronx, New York, US
8
Hbr(Deoxy): paramagnetic properties: faster disappearance MR signal (in rest) Activity: more HbO2 (oxyHb): slower disappearance of signal T2*: sensitive to microcopic field inhomogeneities
Deoxyhemoglobin= paramagnetic
Prasad P et al. Circulation 1996;94:3271-3275
Noninvasive evaluation of intrarenal oxygenation with BOLD MRI 7 healthy volunteers- T2* axial images
9
Lower metabolic activity (furosemide) Less oxygen consumption Increase in Ox/Deoxy ratio Medulla appears brighter After furosemide Before After furosemide Kidney: higher workload leads to lower HbO2 and higher deoxyHb Medulla:
signal so medulla darker than cortex
TE= echo time
Rate of disappearance=R2* decay rate R2* correlates with local deoxyHb level
Echo time
10
Prasad, Circulation 1996 Pruijm, Int J of Hypertension 2013
MR parameter map R2* of each pixel
11
T2* images at different echo times (TE) Matlab/IDL/other software R2* map Anatomic image
12 BOLD MRI Field strength 1.5 T or 3.0 T, 3T preferred if available Sequence 2D multiple Gradient Echo Orientation Coronal oblique to kidneys In-plane resolution 3 mm Slice thickness 3-5 mm Coverage 3-5 slices centered on renal hilum Parallel imaging factor 2 Fat suppression Yes TR (s) 60 - 75 ms TE (ms) 8-16 echoes, up to 50 ms (~T2* cortex) at 3T with choice of in phase for fat-water Averages 1 Breathing mode Breath hold
..Prof. Prasad’s talk Bane et all, under review
Assumption: blood pO2 in equilibrium with tissue pO2
13
Assumption: blood pO2 in equilibrium with tissue pO2
14
Pedersen, KI 2005
15
O
2
Warner L, Glockner JF, Woollard J, et al.Invest Radiol 2011; 46:41-7
16
¹Simon-Zoula, NMR Biomed 19:84-89 , 2006 ²Pruijm, Clin Nephrol 2013 ³Pruijm, Diab Res Clin Practice 2013
4 Khatir, J Magn Reson Imaging 2014;
40:1091-8.
17
18
=cortex Epstein, Diabetes Care 2002 Acute decrease in medullary R2* in 9 healthy volunteers, but not in 9 patients with T2DM =medulla
R2* Medulla Cortex dehydrated hydrated dehydrated hydrated Female 28.25 28.28 17.35 18.08 Female 24.65 27.94 15.17 15.92 Female 30.04 31.15 16.99 18.25 Male 33.2 32.8 17.7 16.76 Male 28.02 28.11 16.63 15.99 Male 26.36 28.57 15.24 14.12 Male 29.72 30.55 16.07 16.03 Male 30.86 29.54 17.85 17.44 Male 30.25 30.44 16.14 16.28 Mean 29.0±2.5 29.7±1.7 16.6±1.0 16.5±1.3
Pruijm, Plos One, 2014 N=9; cross over study. Dehydrated: no water intake for 5 h; Hydrated: 3ml/kg every hour
19
Pruijm, Hofmann et al. Hypertension 2010:1116-22
hypoxia
20
21
Vakilzadeh et al, Diab Res Clin Practice 2019
22
Pruijm, Mendichovszky, Liss et al, NDT supplement 2018
ascending loop driven by basolateral NaK ATPase
consumption
function
23
Spitalewitz S, Circ Res 1982 DB Mount, CJASN 2014
Pruijm, Plos One, 2014 24
– Blood volume fraction – Hemoglobin
Ebrahimi, CJASN 2014
25
26
27
Pruijm et al, Int J Hypertension 2013
Piskunowicz et al, MRI 2015
28
healthy CKD
29
PhD thesis Bastien Milani 2018
20 40 60 80 100 16 18 20 22 24 26 28 Depth (%) R2* (Hz)
Hypoxia Milani B et al, NDT 2017
30
R2* curve: slope
20 40 60 80 100 20 21 22 23 24 25 26 27 Depth (%) R2* (Hz) R2* radial profiles Control Hypertensive CKD
* * * * * * *
31
Milani et al, Nephrology Dialysis Transplantation 2017
10 20 30 40 50 60 70 80 90 100 16 18 20 22 24 26 28 30 Depth (%) R2* (Hz) R2* radial profile Before Furosemide After Furosemid
10 20 30 40 50 60 70 80 90 100 1 1.5 2 2.5 3 3.5 4 Depth (%) R2* (Hz) Response profile
Saad, Textor, Circ Cardiovasc Intervent 2013
32
33
Cox, Frontiers in Physiology, 2017 N=127 N=11
34
Prasad, Am J Nephrology 2019
35
CoV (%) healthy CKD ROI1 3.6-6.8 5.7-12.5 TLCO2 2.2 2.0-3.1 Segmentation3 4.1 Fractional Hypoxia4 <7
1Piskunowicz, MRI 2015 2Milani, NDT 2017 3Cox EF, Frontiers Physiology
2017
4Saad, Radiology 2013
36
ROI placement Manual Cortical ROI 1 stripe / slice ;> 3 slices Medullary ROI 3 samples / slice ;> 3 slices Fitting Monoexponential or log-linear Reporting Cortex and medulla Reported metric R2* (sec-1) Metric statistics reporting Mean, Median, Standard deviation, ROI size Map format Color map Bane, Prasad et all,consensus paper, under review
Future applications:
37
38 1Pruijm, Kidney Internaitonal 2018
39
Curr Opinion Nephrol Hyp 2019
40
Number of functional nephrons Interstitial Fibrosis Time (years) 1 2 3 4 Creatinine Albuminuria Inflammation Hypoxia Hemodynamics
BOLD, ASL T1 Diffusion MRI
41
« If you want to go fast, go alone If you want to go far, go together » Swiss National Science Foundation (FN 320030-169191)
42
43
Epstein, Kidney Int: 51, 1997
Low flow High degree
44
selected from morphological images
slice within a single breath-hold of 16.6 seconds (in expiration) with a modified Multi Echo Data Image Combination sequence (MEDIC) for BOLD analysis
(TE) 6-52.2 ms (equidistant echo time spacing of 4.2 ms), radiofrequency excitation angle 30°, field of view (FOV) 400 x 400 mm2, voxel size 0.8 x 0.8 x 5 mm3, slice thickness 5 mm, slice distance 5.5 mm, bandwidth 331 Hz/pixel, matrix 256x256 (interpolated to 512x512).
45