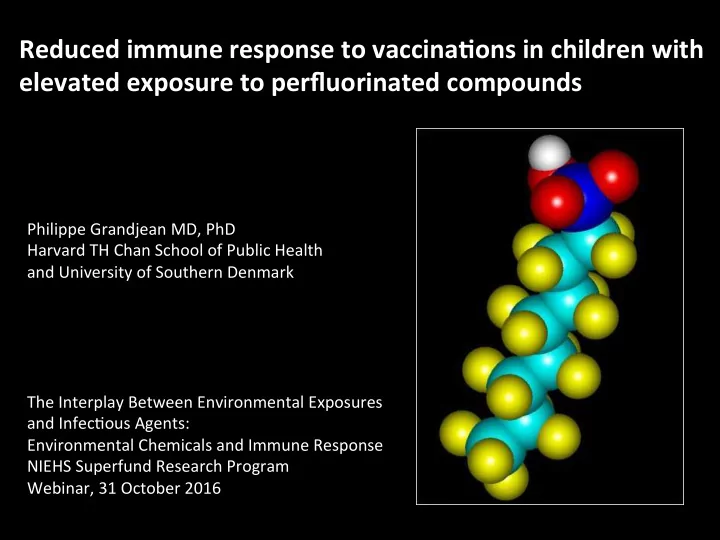

Reduced immune response to vaccinaFons in children with elevated exposure to perfluorinated compounds Philippe Grandjean MD, PhD Harvard TH Chan School of Public Health and University of Southern Denmark The Interplay Between Environmental Exposures and InfecLous Agents: Environmental Chemicals and Immune Response NIEHS Superfund Research Program Webinar, 31 October 2016
Perfluorinated alkyl substances (PFAS) characterisFcs Highly persistent in the environment, global disseminaLon Slightly water soluble, low vapor pressure Easily absorbed in humans EliminaLon half-Lme in humans: several years Pass the placental barrier LactaLonal transfer results in peak exposures in infancy Major adverse effects documented in laboratory animals and also reported in humans : Carcinogenicity Liver enzymes and serum lipids Immunotoxicity Endocrine disrupLon, including delayed breast development Fetal toxicity and adverse pregnancy outcomes
Immunotoxicity Reported in mice and Rhesus monkeys Outcomes are fairly crude: Decreased spleen and thymus weights, lowered total immunoglobulin, and decreased immunocyte cell counts Decreased anLbody responses shown in both mice and monkeys Mediated through PPARα and non-PPARα dependent pathways NTP on PFOS and PFOA: “ presumed to be an immune hazard to humans… – high level of evidence… from animal studies… and moderate level of evidence from studies in humans ”
PFOA: LOAEL higher than highest exposures PFOS: LOAEL similar to human exposures (DeWiN et al., 2012)
Human immunotoxicity : Advantages of vaccine responses in epidemiological studies: • ‘Natural experiment’ • Same dose of anLgen • Same age at exposure • RouLne anLbody assay • Clinical relevance Colourbox.com Colourbox.com
The higher the PCB exposure, the less efficient the response to childhood immunization (here the diphtheria antibody response at 18 months) Heilmann et al., PLoS Medicine, 2006
Change in tetanus anLbody concentraLon a`er booster 1000 Serum concentraFon (IU/mL) M VP-001 W vp-002 M vp-003 100 M vp-004 W vp-005 10 W vp-006 M vp-007 W vp-008 1 0 5 10 15 20 25 30 35 W vp-009 M vp-010 0.1 M Days aNer booster vp-011 Steepness of increase W vp-012 (Kielsen et al., 2015) inversely associated with serum-PFAS
Faroe Islands • Homogeneous, western culture • High parFcipaFon rate in prospecFve studies • Fishing community with high seafood intake • Wide range of exposures from tradi5onal food (pilot whale) • Total populaFon - 48,000 From NASA
VaccinaLon Blood sample AnLbody concentraLon responses to vaccinaLons 5 7 3 5 12 Months Years
Generalized addiLve model with 95% confidence limits (lines at the boNom represent individual subjects in cohort) Grandjean et al., 2012
Odds raLos (ORs) for doubling in child’s age-5 serum-PFAS as predictor of anLbodies below 0.1 IU/mL at age 7 years (i.e., the vaccine did not protect against the disease ) Tetanus (N=18) Diphtheria (N=32) PFOS PFOA PFOS PFOA OR 2.61 4.20 2.38 3.27 95%CI 0.77; 1.54; 0.89; 1.43; 8.92 11.44 6.35 7.51 p 0.12 0.006 0.08 0.006 PFOA showed the strongest effect - ORs below 2.0 for other PFASs Grandjean et al, 2012
Effect of a doubled serum- PFOA at ages 5 and 7 years on serum anLbodies (%) at age 7 years Tet 95% CI Diph 95% CI Regression (7) -20.5 -38.2; 2.1 -25.4 -40.9; -5.8 SEM (5+7) -38.2 -56.1;-13.0 -34.7 -52.5; -10.2 Adjusted* -29.6 -50.6; 0.4 -26.9 -47.4; 1.5 Mogensen et al., 2015 *adjusted for other PFASs (almost unchanged)
Child serum, age 5 r = 0.50 Log serum PFOA (ng/mL) Serum concentraDons of PFOA correlate with other PFASs, but not as closely as other major PFASs Log serum PFOS (ng/mL) Grandjean et al., unpublished
Maternal pregnancy serum r = 0.25 Log serum PFOS (ng/mL) Adjustment for PCB exposure barely affected the results Log serum ∑PCB (µg/g lipid) Grandjean et al., unpublished
Follow-up at age 13 years: AnLbody concentraLons are affected by (unscheduled) booster vaccinaLons Grandjean et al., EHP (in press)
BMC calculaFons N=431 Serum-PFAS at age 5 (complete data only) Serum anFbody at age 7 BMCL at BMR = 5% ~1.3 ng PFOS/mL serum ~0.3 ng PFOA/mL serum for linear curve Lower for log curve Higher for BMR = 10% Environmental Health 2013, 12 :35
Increased risk of infecLon? • In the Odense Child Cohort (Denmark), 359 children aged 1-3 years were monitored for fever and symptoms every 2 weeks for 1 year (by text messages) • Days with fever >38.5º (101.3ºF), comparison of high and low tertiles of maternal pregnancy serum concentrations: – Odds of experiencing days with fever above median for PFOS OR: 2.35 (95%CI: 1.31, 4.11) and PFOA OR: 1.97 (95%CI: 1.07, 3.62) • Higher exposures to PFOA and PFOS tended to increase the proportion of episodes with fever and nasal discharge: for medium tertile PFOA exposure as compared to the low tertile (IRR: 1.38 (95% CI: 1.03,1.86)). • Likewise, higher exposures to PFOA, PFOS and PFHxS tended to increase the proportion of episodes with fever and coughing. Dalsager et al., Environment InternaLonal, 2016
There was an inverse associaLon between the level of anL-rubella anLbodies in the children ’ s serum at age 3 years and the concentraLons of the four PFAS. Furthermore, there was a posiLve associaLon between the maternal concentraLons of PFOA and PFNA and the number of episodes of common cold for the children, and between PFOA and PFHxS and the number of episodes of gastroenteriLs (assessed by quesLonnaire).
Conclusions • PFASs are immunotoxic at current exposures • Vaccine antibody concentrations are sensitive indicators of immunotoxicity • Effects of individual PFASs may be difficult to separate in epidemiological studies • Early development likely represents a highly vulnerable stage (with lactational transfer) • Likely consequences for infectious disease – and perhaps other adverse health effects
transfer via human milk The lowest curve (dashed) is from a non-breasted child, and the upper (solid line) is from a child breasted exclusively for 6 months and parLally the following 5 months Mogensen et al., 2015
Recommend
More recommend