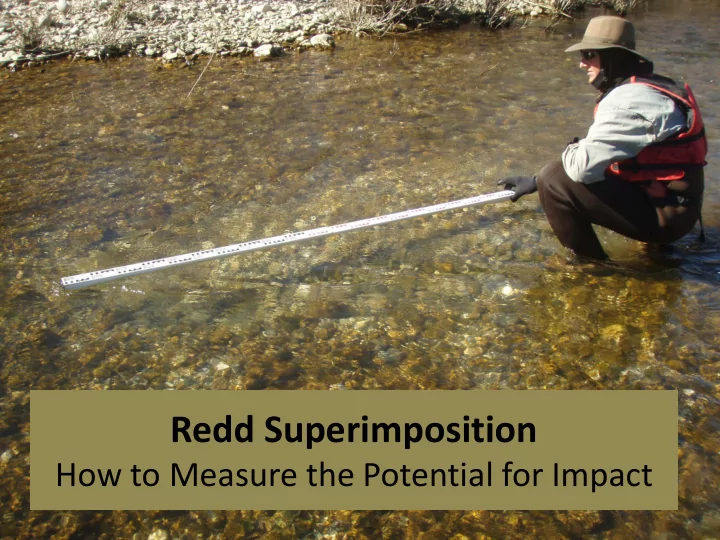

Redd Superimposition How to Measure the Potential for Impact
Previous Superimposition Calculation Ellipse created from avg. redd size Ellipse overlap to determine superimposition Superimposition is defined as the area of overlap between Superimposition two redd ellipses
“Redd superimposition analysis using ArcGIS demonstrated that 2,532 of the 3,354 redds exhibited a measureable degree of superimposition, 1,252 were found to have a level of superimposition greater than 50% [1] (Appendix A, Tables A9-A16).” -Campos and Massa 2011 So… 75% of all Chinook salmon redds in the river showed a measureable degree of ellipse overlap. What does that mean? A: From the representative ellipses created from average measurements of 3,000+ redds observed in 2009: 1. Tail spills overlapped tail spills 2. Redd pots overlapped tail spills 3. Tail spills overlapped redd pots 4. Redd pots overlapped redd pots
What do we know? Redd superimposition has been reported to occur in salmonids when spawning habitats become limited (Weeber et al. 2010), whether by habitat limitations or high spawner abundance. Superimposition has been inferred as a major cause of density-dependent embryo mortality through egg displacement (Prenskiy 1990; Chebanov 1991; Fukushima et al. 1998). Redd superimposition does not necessarily result in egg mortality in the original egg pocket since most superimposing redds are not constructed directly above the preexisting egg pocket of the original redd (SJRRP 2008).
What else do we know? Higher spawning densities may increase the likelihood of finding a mate, lower the risk of predation, and improve the fitness of offspring (Liermann and Hilborn 2001; Reynolds and Gross 1992). Bed mobilization and increased bed roughness as a result of aggregate spawning activity has been demonstrated to reduce algal accumulations and silt deposition on gravel surfaces, thus improving the permeability of the spawning beds and resulting in increased hyporheic flows within individual redds (Peterson and Foote 2000; Moore et al. 2004; Moore 2006). Aggregate or mass spawning may actually improve habitat quality by redistributing, sorting and cleaning of spawning gravels (McNeil and Ahnell 1964; Montgomery et al. 1996; Moore et al. 2004; Schuett-Hames 2000). Some salmonid species have been found to preferentially spawn near existing redds, and that factors other than fish density and habitat availability determine redd location selection (Essington et al. 1998).
Figure 1. Diagrammatic side view of a Chinook salmon redd showing the relative location and mean depth of egg pockets on the Trinity River, CA, as reported in Evenson (2001).
Figure 2. Illustrative side view of a salmonid redd showing the location of the egg pocket (pit), as presented in SWRCB (2007).
Figure 3. Side-view diagram of the stream substrate at a bull trout redd showing the relative locations of the egg pockets, as reported in Weeber et al. (2010).
Figure 4. Diagrammatic view of a fall-run Chinook salmon redd measured daily, from Burner (1951) as reproduced by Gallagher et al. (2007).
Create separate pot and tail spill ellipses!
Pot Length Tail Spill Length
Pot Length Tail Spill Length Figure 5. Diagrammatic view of a fall-run Chinook salmon redd measured daily, demonstrating the representative pot and tail spill polygons (in red) using actual lower Yuba River redd measurement conventions. Note that lower Yuba River redd measurements were taken of only the visible pot length resulting in a measureable truncation of total pot dimensions.
Measured Pot Length Measured Pot Length 2
Tail Spill Begins at ½ Pot Length Tail Spill Ellipse Pot Ellipse
To create a representative egg pocket! Tail Spill Ellipse Flow Vector Recorded Redd Position Tail Spill Ellipse Drawn at Original Pot Length Measurement Egg Pocket Pot Ellipse
Recorded Redd Position Egg Pocket
Potential for superimposition impact is defined as the area where a new pot ellipse overlaps the egg pocket from a previously occurring redd. Egg Pocket Pot Ellipse Tail Spill Ellipse Indicator of Superimposition No Impact Impact No Impact Adjacent Pot Ellipse
Index of Superimposition Impact is the total number of redds demonstrating a measurable degree of superimposition, is the total number of redds observed during the survey season, And is the average measure of overlap for redds exhibiting superimposition.
Table 1. Weekly observed Chinook salmon redds, number of redds with measureable egg pocket ellipse overlap, average egg pocket ellipse overlap and index of redd superimposition impact in the surveyed reaches of the lower Yuba River, CA from August 31, 2009 to December 31, 2010. Shaded areas represent surveys that were incomplete or suspended due to high flows and/or turbidity. Redds with Egg Pocket Average Egg Pocket Index of Superimposition Survey Week Total Redds Observed Overlap Overlap Impact 9/7/2009 7 0 0.00 0.00 9/14/2009 108 3 0.40 0.01 9/21/2009 358 32 0.29 0.03 9/28/2009 712 106 0.36 0.05 10/5/2009 1226 257 0.41 0.09 10/12/2009 1246 267 0.41 0.09 10/19/2009 1812 415 0.43 0.10 10/26/2009 2317 602 0.42 0.11 11/2/2009 2642 701 0.43 0.11 11/9/2009 2832 782 0.43 0.12 11/16/2009 2967 843 0.42 0.12 11/23/2009 3102 914 0.42 0.13 11/30/2009 3165 960 0.43 0.13 12/7/2009 3217 986 0.43 0.13 12/14/2009 3249 1005 0.43 0.13 12/21/2009 3264 1017 0.43 0.13 12/28/2009 3276 1021 0.43 0.13 9/13/2010 12 0 0.00 0.00 9/20/2010 207 2 0.22 0.00 9/27/2010 656 45 0.40 0.03 10/4/2010 1178 163 0.40 0.06 10/11/2010 1600 284 0.40 0.07 10/18/2010 1973 397 0.42 0.08 10/25/2010 1982 401 0.42 0.08 11/1/2010 1982 401 0.42 0.09 11/8/2010 2606 599 0.43 0.10 11/15/2010 2879 725 0.44 0.11 11/22/2010 3003 801 0.44 0.12 11/29/2010 3090 853 0.45 0.12 12/6/2010 3090 853 0.45 0.12 12/13/2010 3098 854 0.45 0.12 12/20/2010 3098 854 0.45 0.12 12/27/2010 3098 854 0.45 0.12
Recommend
More recommend