
SLIDE 1
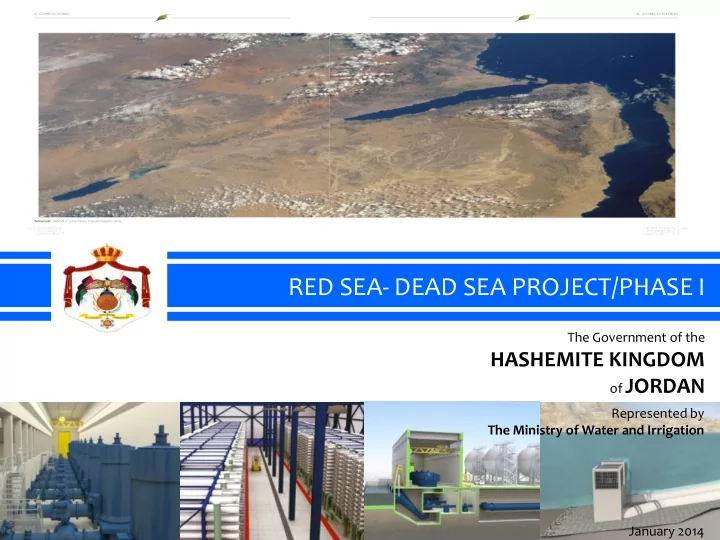
RED SEA- DEAD SEA PROJECT/PHASE I
The Government of the
HASHEMITE KINGDOM
- f JORDAN
Represented by The Ministry of Water and Irrigation January 2014
RED SEA- DEAD SEA PROJECT/PHASE I The Government of the HASHEMITE - - PowerPoint PPT Presentation
RED SEA- DEAD SEA PROJECT/PHASE I The Government of the HASHEMITE KINGDOM of JORDAN Represented by The Ministry of Water and Irrigation January 2014 Establish a Secure and Affordable Water Supply for Jordan while Saving the Dead Sea from
The Government of the
Represented by The Ministry of Water and Irrigation January 2014
2015 2020 2025 2030 2035
MCM/Yr MCM/Yr MCM/Yr MCM/Yr MCM/Yr
Demand Supply Deficit Demand Supply Deficit Demand Supply Deficit Demand Supply Deficit Demand Supply Deficit
Base Deficit
345.6 321.0 -39.8 391.0 321.0
429.6 321.0 -108.5 472.0 321.0
518.5 321.0
Add 25%(15% Physical Losses, 10% Influx from neighboring Countries
240.8 -104.8 240.8 -150.2 240.8 -188.8 240.8
240.8
Add Reduction of
0.0
Total Deficit in the Kingdom w/o Disi
Disi
100.0 100.0 100.0 100.0 100.0
Kingdom with Disi
Jordan ranks as the 3rd poorest nation in terms of freshwater resources at 133m3/person/year
Ministry of Water and Irrigation
Ministry of Water and Irrigation
6
Coyne et Bellier
ERM Social Assessment
Professors Allan, Tsur and Malkawi
Thetis
Tahal
7
Cyanobacteria
0 100 200 300 400 500 600 700 800 900 1000
Level drop Level rise Mono mictic Mero mictic ?
seasonal long term, dilution
Dunaliella
(crystal size, growth rate)
Acceleration (?)
Due to dilution
More sinkholes Minor depletion No depletion ?
Treatment and Desalination Plant (80-100)
Freshwater Booster Pump Station to Aqaba
Freshwater Conveyance
Seawater Conveyance
Seawater Intake Pump Station
Intake Structure
Red Sea Aqaba
Desalination Brine Conveyance
Desalination Brine Pressure Regulation
1- (Reservoir) at high point Two desalination Brine Booster Pump
Dead Sea Red Sea Amman Aqaba
Government of Jordan Government of Israel Palestinian Authority
(mcm/yr) (mcm/yr) (mcm/yr)
1 Red Sea Desalination Water
(80-100 mcm/yr) Delivered by Phase I - RSDS Project
30-50 50
Lake Tiberias Transfer Water
(50 mcm/yr) Delivered by Beit Zera - KAC Pipeline
50
(20-30 mcm/yr) Delivered through Israel's National Carrier
Potential Total Annual Water Supply 80-100 50 20-30 Recipient Beneficial Parties Water Supplies
The Gulf of Aqaba is Protected, no Environmental effects Infrastructure is Designed to be Expanded No Infrastructure is Abandoned in Future Phases The Phase I Desalination Facility at Aqaba Provides Flexibility in
Project Financing is Feasible through a Combination of
The Project Initiates the Process to Save the Dead Sea
Preparation of RFP for the Selection and Assignment of a Specialized Engineering Firms to prepare Preliminary Design, Legal and Financial Terms, and Tender Documents based on BoT and PPP participation. DRAFT RFP is AVAILABLE
Preparation of Tender Documents 12 months: Starts in March, 2014 Tendering
Contract for BOT Contractors Nov, 2014 Final Selection of preferred bidder May, 2015 Beginning of Construction Phase Jan, 2016 Duration of Construction 30 months