
SLIDE 1
1
Recovery Plan for Zebra Chip of Potato Charlie Rush Texas A&M - - PowerPoint PPT Presentation
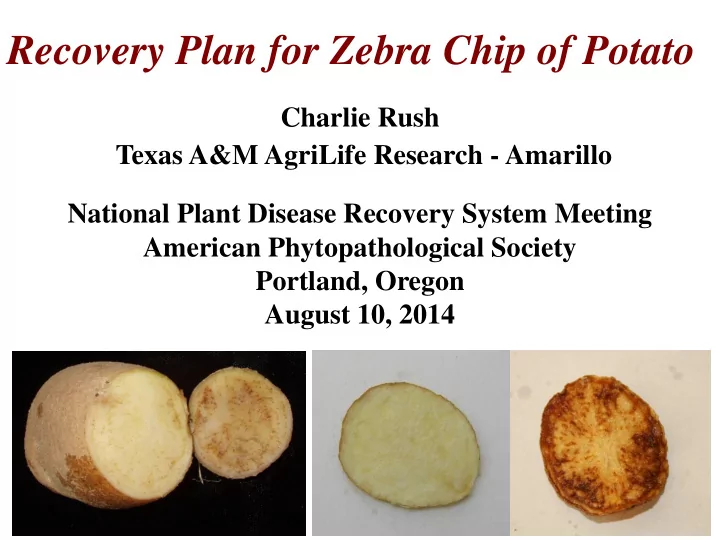
Recovery Plan for Zebra Chip of Potato Charlie Rush Texas A&M AgriLife Research - Amarillo National Plant Disease Recovery System Meeting American Phytopathological Society Portland, Oregon August 10, 2014 1 U.S. Potato Production
1
WI 16% OR 5% ID 28% Others 28% CO 6% ND 5% WA 22%
When ZC was first identified, the cause of the disease was unknown, making identification, management and all investigative research extremely difficult
and unreliable for diagnostics
Kansas, Nebraska and Wyoming (identified in some seed production areas)
Candidatus Liberibacter solanacearum was reported as the putative pathogen causing ZC and the Potato Psyllid was reported as vector – accurate diagnostic techniques were rapidly developed
multistate, multidisciplinary team to study all aspects of ZC.
Bushl and Kno wn ZC Plan t -ve Plant +ve N T C
22 inch rainfall line
Possible source for PNW ??
Overwintering Populations Northern Migration?
1 2 3 4 5
Yellow Sticky Traps Leaf Samples
NM, MN, TX, WI and Manitoba
for Lso since inception of the program in 2009
and industry personnel
had greater cold tolerance than psyllids from Texas
**Kylie Swisher, J. Munyaneza and J. Crosslin. 2012. Environ. Entomol. 41(4): 1019-1028.
populations of psyllids
mitochondrial Cytochrome C Oxidase subunit I-like gene
Southwest, Central and Northwest USA included in test
Northwest were clearly a different population
**Kylie Swisher, J. Munyaneza and J. Crosslin. 2012. Environ. Entomol. 41(4): 1019-1028
psyllids supported identification of three distinct populations
population in the PNW raised questions about migration theory*
** In 2011, potato psyllid
(Solanum dulcamara). Observations confirmed in 2012-2013 in ID and WA.
Wen et al, 2009 Plant Dis. 93:1102-1115
Clade 1 (C1) Clade 2 (C2)
SNP 1891- 1892 1897- 1898 1977 2089 2252 2294 C1
C G C C2 G T A T A T
Photo: Courtesy Cecilia Tamborindeguy
(Field Mature Samples From 2005 To 2008)
Plant tissue (12 field potato samples)
cPCR assay (Lso positive%) Real-time PCR Mean
Wen et al, 2009 Liefting et al, 2009 Hansen et al, 2008 ZCf/HLBr/ HLBp
leaf 0.0 0.0 16.7 8.3 6.3 c midvein 0.0 8.3 33.3 16.7 14.6 c petiole 16.7 33.3 50.0 41.7 35.4 d stem 41.7 58.3 83.3 83.3 66.7 b stolon 91.7 91.7 100.0 100.0 95.8 a Mean 30.0 c 38.3 bc 56.7 a 50.0 ab 43.7
9 8 7 6 5 4 3 2 1
Weeks before harvest
10 20 30 40 50 60 20 40 60 80 100 120
Days to Emerge Percent emerged
Percent germinated Days to emerge
Percent emerged Days to emerge
Tubers infected 1 wk all tested negative at harvest
Since most of the potatoes infested 2 wk before harvest, and all those infested 1 wk before harvest, tested negative for the pathogen, why was there such a low percent emergence?
Stolon attachment
0% 10% 20% 30% 40% 50% 60% 70% 80% 90% 100%
14DBH 10 DBH 4 DBH Percentage tubers tested positive
70 Tuber
development
80 Maturation Bulking-up 90 Senescence 30 Main stem elongation 40 Tuber formation 50 Flower emergence 60 Flowering Planting 10 Emergence 20 Stem formation
Movento
2 applications 7-10 days
No additional neonicotinoid
Neonicotinoid
Presumed, primary ZC “infection” window Psyllid control window
OBERON
2 applications 7-10 days
Agrimec
2 applications 7-10 days
Measures of lethal imidacloprid doses (mg a.i.). RR50=3.4, RR90=6.4
Resistance detected in current TX psyllid population (Tex 12)!
host/pathogen/vector interactions
model – pathogen/vector ecology and epidemiology
insecticide applications – better monitoring will be required
prevent/slow vector resistance
and Lso/ZC development in storage
regard to disease and vector identification
management options and risks of
reporting session
can use for information retrieval and decision support
the primary source of information
Informative management tools