
SLIDE 1
6/11/2018 1
Credit: Urban Design Lab, Columbia University
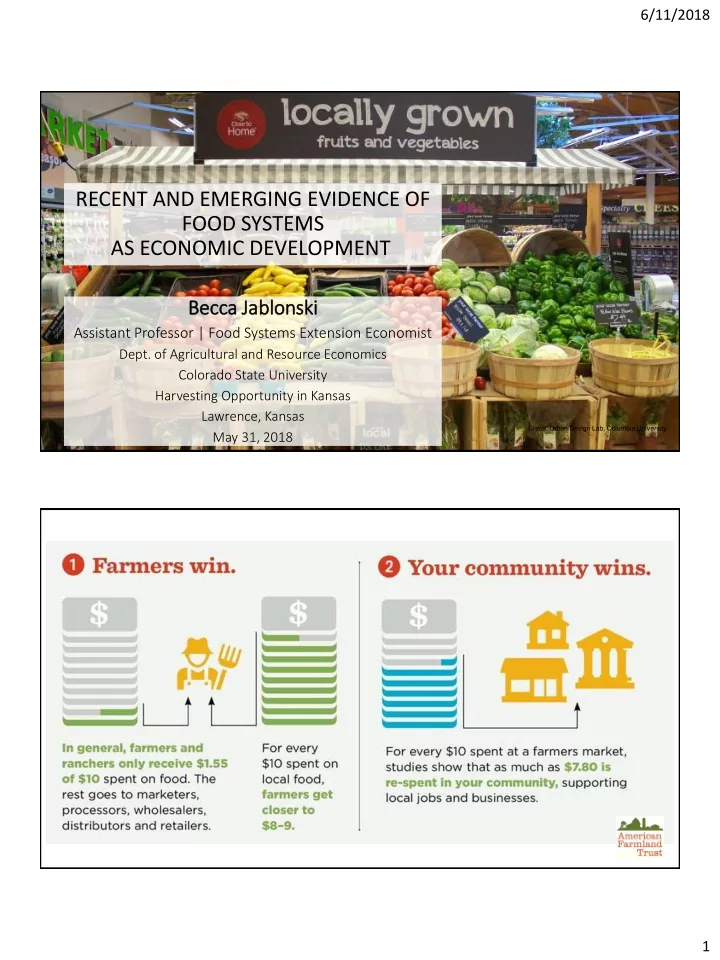
RECENT AND EMERGING EVIDENCE OF FOOD SYSTEMS AS ECONOMIC DEVELOPMENT
Becc Becca Ja Jabl blonski i
Assistant Professor | Food Systems Extension Economist
- Dept. of Agricultural and Resource Economics
Colorado State University Harvesting Opportunity in Kansas Lawrence, Kansas May 31, 2018