Rearranging and manipulating h e a d e r = T R U E , n - - PDF document

rearranging and manipulating
SMART_READER_LITE
LIVE PREVIEW

Rearranging and manipulating h e a d e r = T R U E , n - - PDF document

An introduction to WS 2019/2020 m y d a t a < - r e a d . t a b l e ( fj l e = " m y d a t a . t x t " , Rearranging and manipulating h e a d e r = T R U E , n a . s t r i n g


slide-1
SLIDE 1

m y d a t a <

  • r

e a d . t a b l e ( fj l e = " m y d a t a . t x t " , h e a d e r = T R U E , n a . s t r i n g s = " n " )

What was the sign for missing data in mydata.txt?

Answer: “n”

What is written in the first line of mydata.txt?

Answer: column names

Is the command correct?

Answer: YES!

An introduction to WS 2019/2020

  • Dr. Noémie Becker
  • Dr. Eliza Argyridou

Special thanks to:

  • Dr. Benedikt Holtmann and Dr. SOnja Grath for sharing slides for this lecture

Rearranging and manipulating data

3

What you should know after day 5

Rearranging and manipulating data

  • Reshaping data
  • Combining data sets
  • Making new variables
  • Subsetting data
  • Summarizing data

We will work with two particular packages:

  • t

i d y r

  • d

p l y r

What do we have to do before we can work with a package in R? (2 things)

YOUR TURN

4

What you should know after day 5

Rearranging and manipulating data

  • Reshaping data
  • Combining data sets
  • Making new variables
  • Subsetting data
  • Summarizing data

5

Reshaping data

We will use data on fish abundance.

  • Download the file F

i s h _ s u r v e y . c s v from the course page. Set directory, for example: s e t w d ( " ~ / D e s k t

  • p

/ D a y _ 5 " )

  • Import the sample data into a variable F

i s h _ s u r v e y : F i s h _ s u r v e y <

  • r

e a d . c s v ( " F i s h _ s u r v e y . c s v " , h e a d e r = T R U E ) h e a d ( F i s h _ s u r v e y ) 6
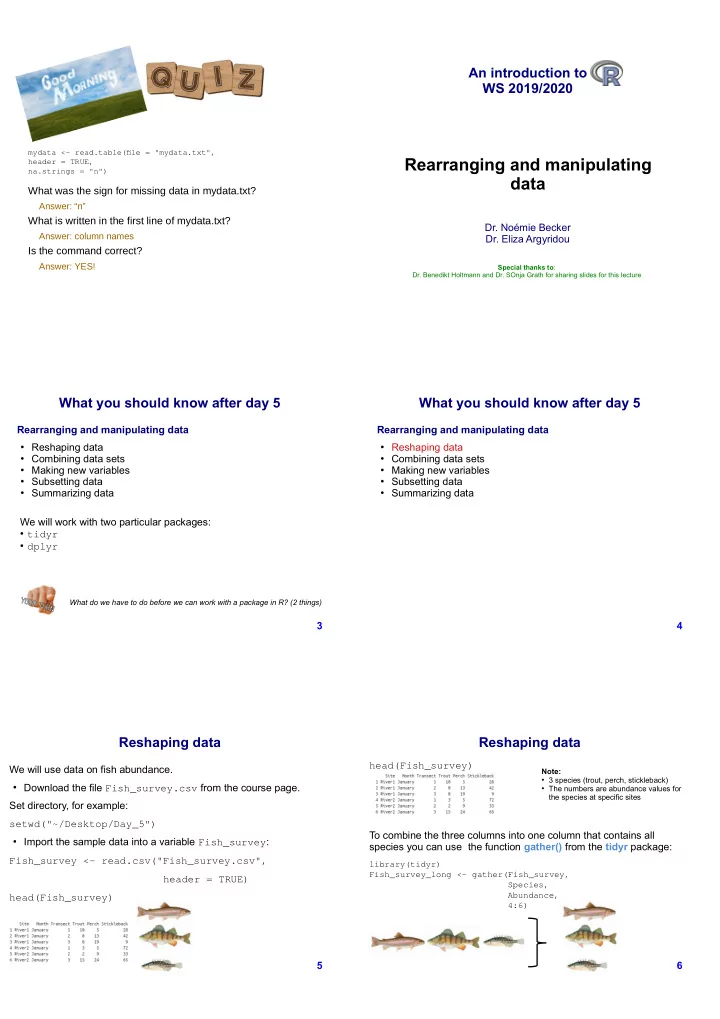
Reshaping data

h e a d ( F i s h _ s u r v e y ) To combine the three columns into one column that contains all species you can use the function gather() from the tidyr package:

l i b r a r y ( t i d y r ) F i s h _ s u r v e y _ l

  • n

g <

  • g

a t h e r ( F i s h _ s u r v e y , S p e c i e s , A b u n d a n c e , 4 : 6 )

Note:

  • 3 species (trout, perch, stickleback)
  • The numbers are abundance values for

the species at specific sites

slide-2
SLIDE 2

7

Reshaping data

F i s h _ s u r v e y _ l

  • n

g <

  • g

a t h e r ( F i s h _ s u r v e y , S p e c i e s , A b u n d a n c e , 4 : 6 ) h e a d ( F i s h _ s u r v e y _ l

  • n

g ) t a i l ( F i s h _ s u r v e y _ l

  • n

g ) 8

Reshaping data

To convert the data back into a format with separate columns for each species, you can use the function spread() from the tidyr package: F i s h _ s u r v e y _ w i d e <

  • s

p r e a d ( F i s h _ s u r v e y _ l

  • n

g , S p e c i e s , A b u n d a n c e ) 9

What you should know after day 5

Rearranging and manipulating data

  • Reshaping data
  • Combining data sets
  • Making new variables
  • Subsetting data
  • Summarizing data

10

Combining data

We now want to combine the information given by three different data sets. To combine the data sets we will use the package dplyr: l i b r a r y ( d p l y r )

F i s h _ s u r v e y . c s v W a t e r _ d a t a . c s v G P S _ d a t a . c s v

11

Combining data

We can join data sets by using the columns they share.

Fish survey Site Month Transect Species Water characteristjcs Site Month Water temp. O2 - content GPS Site Transect Latjtude Longitude

12

Which function could we use here?

Functjons to combine data sets in dplyr

lefu_join(a, b, by = "x1") Joins matching rows from b to a right_join(a, b, by = "x1") Joins matching rows from a to b inner_join(a, b, by = "x1") Returns all rows from a where there are matching values in b full_join(a, b, by = "x1") Joins data and returns all rows and columns semi_join(a, b, by = "x1") All rows in a that have a match in b, keeping just columns from a. antj_join(a, b, by = "x1") All rows in a that do not have a match in b

YOUR TURN

slide-3
SLIDE 3

13

Combining data

1) Join water characteristics to fish abundance data using inner_join() F i s h _ a n d _ W a t e r <

  • i

n n e r _ j

  • i

n ( F i s h _ s u r v e y _ l

  • n

g , W a t e r _ d a t a , b y = c ( " S i t e " , " M

  • n

t h " ) ) 14

Combining data

2) Add GPS locations to new Fish_and_Water data set using inner_join() F i s h _ s u r v e y _ c

  • m

b i n e d <

  • i

n n e r _ j

  • i

n ( F i s h _ a n d _ W a t e r , G P S _ l

  • c

a t i

  • n

, b y = c ( " S i t e " , " T r a n s e c t " ) ) 15

What you should know after day 5

Rearranging and manipulating data

  • Reshaping data
  • Combining data sets
  • Making new variables
  • Subsetting data
  • Summarizing data

16

Adding new variables

We will use data on bird behaviour. B i r d _ B e h a v i

  • u

r <

  • r

e a d . c s v ( " B i r d _ B e h a v i

  • u

r . c s v " , h e a d e r = T R U E , s t r i n g s A s F a c t

  • r

s = F A L S E ) # G e t a n

  • v

e r v i e w s t r ( B i r d _ B e h a v i

  • u

r )

X1 X2 A 1 B 1 A 2 B 2 X1 X2 X3 A 1 T B 1 F A 2 T B 2 F

We want to add the new variable (column) l

  • g

_ F I D 17

Adding new variables

Three possibilities: a) Using $

B i r d _ B e h a v i

  • u

r $ l

  • g

_ F I D <

  • l
  • g

( B i r d _ B e h a v i

  • u

r $ F I D )

b) Using the [ ] - operator

B i r d _ B e h a v i

  • u

r [ , " l

  • g

_ F I D " ] <

  • l
  • g

( B i r d _ B e h a v i

  • u

r $ F I D )

c) Using the function mutate() from dplyr package

B i r d _ B e h a v i

  • u

r <

  • m

u t a t e ( B i r d _ B e h a v i

  • u

r , l

  • g

_ F I D = l

  • g

( F I D ) )

18

Adding new variables

The outcome:

h e a d ( B i r d _ B e h a v i

  • u

r )

slide-4
SLIDE 4

19

Adding new variables

We can split one column into two using the function separate() from dplyr package: B i r d _ B e h a v i

  • u

r <

  • s

e p a r a t e ( B i r d _ B e h a v i

  • u

r , S p e c i e s , c ( " G e n u s " , " S p e c i e s " ) , s e p = " _ " , r e m

  • v

e = T R U E )

X1 X2 A 1_1 B 1_2 A 2_1 B 2_2 X1 X2.1 X2.2 A 1 1 B 1 2 A 2 1 B 2 2

20

Combining variables

We can combine two columns into one using the function unite() from the tidyr package: B i r d _ B e h a v i

  • u

r <

  • u

n i t e ( B i r d _ B e h a v i

  • u

r , " G e n u s _ S p e c i e s " , c ( G e n u s , S p e c i e s ) , s e p = " _ " , r e m

  • v

e = T R U E )

X1 X2 A 1_1 B 1_2 A 2_1 B 2_2 X1 X2.1 X2.2 A 1 1 B 1 2 A 2 1 B 2 2

21

What you should know after day 5

Rearranging and manipulating data

  • Reshaping data
  • Combining data sets
  • Making new variables
  • Subsetting data
  • Summarizing data

22

Subsetting data

You can subset your data with:

  • The [ ]-operator
  • The function subset()
  • With functions from the dplyr package

 slice()  filter()  sample_frac()  sample_n()  select()

23

Subsetting data with the [ ]-operator

Examples:

# s e l e c t s t h e fj r s t 4 c

  • l

u m n s B i r d _ B e h a v i

  • u

r [ , 1 : 4 ] # s e l e c t s r

  • w

s 2 a n d 3 B i r d _ B e h a v i

  • u

r [ c ( 2 , 3 ) , ] # s e l e c t s t h e r

  • w

s 1 t

  • 3

a n d c

  • l

u m n s 1 t

  • 4

B i r d _ B e h a v i

  • u

r [ 1 : 3 , 1 : 4 ] # s e l e c t s t h e r

  • w

s 1 t

  • 3

a n d 6 , a n d t h e c

  • l

u m n s 1 t

  • 4

# a n d 8 B i r d _ B e h a v i

  • u

r [ c ( 1 : 3 , 6 ) , c ( 1 : 4 , 8 ) ]

24

Subsetting data with the [ ] and $-operators

Example: # s e l e c t s a l l r

  • w

s w i t h m a l e s B i r d _ B e h a v i

  • u

r [ B i r d _ B e h a v i

  • u

r $ S e x = = " m a l e " , ]

slide-5
SLIDE 5

25

Subsetting data with subset()

? s u b s e t ( )

Argument Descriptjon x The object from which to extract subset subset A logical expression that describes the set of rows to return select An expression indicatjng which columns to return

26

Examples What will R return in these cases?

s u b s e t ( B i r d _ B e h a v i

  • u

r , F I D < 1 ) # s e l e c t s a l l r

  • w

s w i t h F I D s m a l l e r t h a n 1 m s u b s e t ( B i r d _ B e h a v i

  • u

r , F I D < 1 & S e x = = " m a l e " ) # s e l e c t s a l l r

  • w

s f

  • r

m a l e s w i t h F I D s m a l l e r t h a n # 1 s u b s e t ( B i r d _ B e h a v i

  • u

r , F I D > 1 | F I D < 1 5 , s e l e c t = c ( I n d , S e x , Y e a r ) ) # s e l e c t s a l l r

  • w

s t h a t h a v e a v a l u e

  • f

F I D # g r e a t e r t h a n 1

  • r

l e s s t h a n 1 5 . W e k e e p

  • n

l y # t h e I N D , S e x a n d Y e a r c

  • l

u m n

YOUR TURN

27

Subsetting rows in dplyr

Subsettjng by rows using slice() and fjlter() Examples slice() and fjlter(): B i r d _ B e h a v i

  • u

r . s l i c e <

  • s

l i c e ( B i r d _ B e h a v i

  • u

r , 3 : 5 ) # s e l e c t s r

  • w

s 3

  • 5

B i r d _ B e h a v i

  • u

r . fj l t e r <

  • fj

l t e r ( B i r d _ B e h a v i

  • u

r , F I D < 5 ) # s e l e c t s r

  • w

s t h a t m e e t c e r t a i n c r i t e r i a 28

Subsetting rows in dplyr

You can take a random sample of rows with sample_frac() and sample_n() Examples sample_frac() and sample_n(): B i r d _ B e h a v i

  • u

r . 5 <

  • s

a m p l e _ f r a c ( B i r d _ B e h a v i

  • u

r , s i z e = . 5 , r e p l a c e = F A L S E ) # t a k e s r a n d

  • m

l y 5 %

  • f

t h e r

  • w

s B i r d _ B e h a v i

  • u

r _ 5 R

  • w

s <

  • s

a m p l e _ n ( B i r d _ B e h a v i

  • u

r , 5 , r e p l a c e = F A L S E ) # t a k e s r a n d

  • m

l y 5 r

  • w

s 29

Subsetting columns in dplyr

You can subset by columns with select() Examples: B i r d _ B e h a v i

  • u

r _ c

  • l

<

  • s

e l e c t ( B i r d _ B e h a v i

  • u

r , I n d , S e x , F l e d g l i n g s ) # s e l e c t s t h e c

  • l

u m n s I n d , S e x , a n d F l e d g l i n g s B i r d _ B e h a v i

  • u

r _ r e d u c e d <

  • s

e l e c t ( B i r d _ B e h a v i

  • u

r ,

  • D

i s t u r b a n c e ) # e x c l u d e s t h e v a r i a b l e d i s t u r b a n c e 30

What you should know after day 5

Rearranging and manipulating data

  • Reshaping data
  • Combining data sets
  • Making new variables
  • Subsetting data
  • Summarizing data
slide-6
SLIDE 6

31

Summarizing your data

You can summarize your data with dplyr Example: Get the overall mean for FID using summarize() and mean() s u m m a r i z e ( B i r d _ B e h a v i

  • u

r , m e a n . F I D = m e a n ( F I D ) ) m e a n . F I D 1 1 1 . 8 2 6 3 9 32

Summarizing your data

We can add more measurements to our summary:

s u m m a r i z e ( B i r d _ B e h a v i

  • u

r , m e a n . F I D = m e a n ( F I D ) , # m e a n m i n . F I D = m i n ( F I D ) , # m i n i m u m m a x . F I D = m a x ( F I D ) , # m a x i m u m m e d . F I D = m e d i a n ( F I D ) , # m e d i a n s d . F I D = s d ( F I D ) , # s t a n d a r d d e v i a t i

  • n

v a r . F I D = v a r ( F I D ) , # v a r i a n c e n . F I D = n ( ) ) # s a m p l e s i z e m e a n . F I D m a x . F I D m e d . F I D s d . F I D v a r . F I D n . F I D 1 1 1 . 8 2 6 3 9 3 1 8 . 8 2 3 6 6 5 . 3 1 9 3 1 4 4

33

How can we get summaries for each species?

Before you can calculate these summaries, you have to apply the group_by() function from the dplyr package:

B i r d _ B e h a v i

  • u

r _ b y _ S p e c i e s <

  • g

r

  • u

p _ b y ( B i r d _ B e h a v i

  • u

r , G e n u s _ S p e c i e s )

34

How can we get summaries for each species?

Now we can get summaries for each species:

S u m m a r y _ s p e c i e s <

  • s

u m m a r i z e ( B i r d _ B e h a v i

  • u

r _ b y _ S p e c i e s , m e a n . F I D = m e a n ( F I D ) , # m e a n m i n . F I D = m i n ( F I D ) , # m i n i m u m m a x . F I D = m a x ( F I D ) , # m a x i m u m m e d . F I D = m e d i a n ( F I D ) , # m e d i a n s d . F I D = s d ( F I D ) , # s t a n d a r d d e v i a t i

  • n

v a r . F I D = v a r ( F I D ) , # v a r i a n c e n . F I D = n ( ) ) # s a m p l e s i z e S u m m a r y _ s p e c i e s We can make a data frame out of a tibble with: a s . d a t a . f r a m e ( S u m m a r y _ s p e c i e s )

35

Take-home message

  • use g

a t h e r ( ) and s p r e a d ( ) for combining or splitting columns

  • use X

X _ j

  • i

n ( ) for combining datasets

  • functions from package dplyr allow for easy dataset splitting,

modifying, summarizing etc...