
SLIDE 1
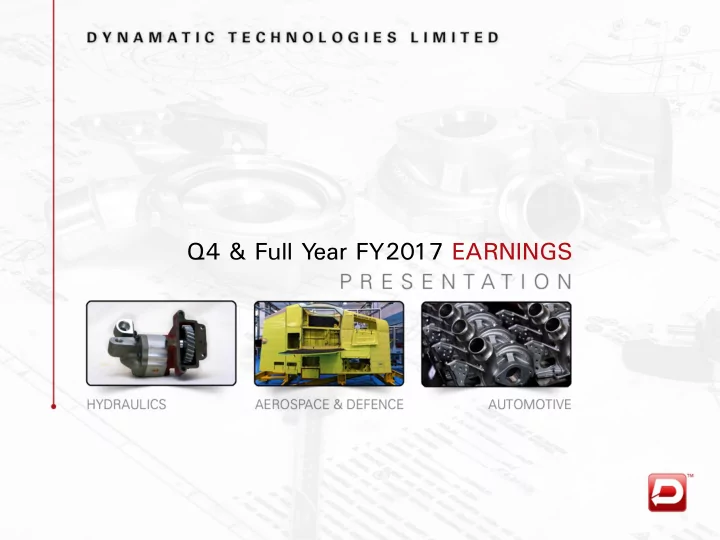
Q4 & Full Y ear FY2017 EARNINGS 12M FY2017 Revenue Breakup Net - - PowerPoint PPT Presentation
Q4 & Full Y ear FY2017 EARNINGS 12M FY2017 Revenue Breakup Net Revenue of Rs.15,078 mn; up 0.9% from 12M FY2017 Rs.14,938 mn last year 12M FY2016 Aerospace & Defence segment revenue o of Rs.3,457 mn; up 28.1% from Rs. 23% 2,698
64% 18% 18% 59% 18% 23%
Automotive Hydraulics Aerospace & Defence
3
12M FY2017 12M FY2016
and Hydraulics segments
segments increased substantially by 28.1% and 6.0%, respectively on a y-o-y basis
client deliveries for new projects. Deliveries of all three new projects namely Airbus, Boeing and Bell started. Hydraulics segment growth was largely stable
4
Revenue 3,783 3,878 (2.5)% 3,520 7.5% 15,078 14,938 0.9% EBITDA 388 528 (26.4)% 335 15.7% 1,653 1,411 17.2% 10.3% 13.6% 9.5% 11.0% 9.4% Profit After Tax (PAT) (74) 192 nm 12 nm 146 123 19.0% nm 5.0% 0.3% 1.0% 0.8% Basic EPS (Rs.) (11.76) 30.30 nm 1.86 nm 23.02 19.36 19.1% Adjusted PAT (Rs.) (8) 192 nm 12 nm 213 123 73.4% nm 5.0% 0.3% 1.4% 0.8%
Note: PAT was negatively impacted due to an one time exceptional item of Rs. 101 mn, on account of foreclosure of high cost borrowing. Adjusted PAT excludes exceptional items amounting to Rs. 78.8 mn from Indian operations net of standalone FY2017 effective tax rate and Rs. 22.4 mn from foreign operations without any applicable tax rate
5
6
7
8
9
10
mn would be Rs. 15,242 mn, representing a growth of 2.0% y-o-y compared to 0.9% growth before adjustment
mn would be Rs. 1,704 mn, representing a growth of 20.8% y-o-y (vs. 17.2%)
a positive impact on performance. However, GBP denominated transactions had an unfavorable impact. Impact from USD was relatively flat y-o-y EURO vs. INR 73.59 72.31 1.28 74.35 (0.76) GBP vs. INR 87.66 98.76 (11.11) 89.30 (1.64) USD vs. INR 67.10 65.46 1.64 67.12 (0.02) EURO GBP EURO EURO GBP EURO Revenue (Rs. mn) 33.9 (67.9) 1.4 (37.4) 134.9 (279.7) 6.9 (164.3) EBITDA (Rs. mn) 2.1 (77.0) 1.4 (9.0) 6.6 (38.0) 6.9 (50.9)
11
India
653 521 581 2,265 1,475
UK
250 262 293 1,192 1,223
India
200 257 188 809 598
UK
39 24 85 238 166
India 72% UK 28%
12
India
483 423 500 1,908 1,655
UK
217 261 196 862 959
India
91 76 80 335 283
UK
24 34 15 63 43
India 69% UK 31%
13 Note: India – M: India – Machining India – F: India – Iron Foundry
demand remained subdued resulting in a decreased topline for the Company. Pre demonetization H1 revenues were 14.6% higher than H2 revenues. Growth in Germany impacted by the global Volkswagen problem
Germany to drive both revenue and profitability in the coming year
components, customer diversification, steel castings and capacity utilization
India 13% Germany 87%
14 62% 61% 60% 55% 58% 18% 17% 18% 20% 19% 20% 22% 22% 25% 24% Q4 FY16 Q1 FY17 Q2 FY17 Q3 FY17 Q4 FY17 Automotive Hydraulics Aerospace & Defence 528 485 451 335 388 13.6% 12.3% 11.8% 9.5% 10.3% Q4 FY16 Q1 FY17 Q2 FY17 Q3 FY17 Q4 FY17 3,878 3,946 3,828 3,520 3,783 6.9% 1.8% (3.0)% (8.1)% 7.5% Q4 FY16 Q1 FY17 Q2 FY17 Q3 FY17 Q4 FY17
(Rs. million) Mar 31, 2017 Dec 31, 2016 Long Term Borrowings 5,092 4,936 Short Term Borrowings 1,559 1,313 Total Debt 6,651 6,249 Less: Cash & Cash Equivalents 826 318 Net Debt 5,825 5932 Net Worth 2,464 2,592
Note: Interest Coverage ratio = Operating Profit/Interest Expense
15
177 181 188 177 195 2.2x 1.9x 1.7x 1.1x 1.2x Q4 FY16 Q1 FY17 Q2 FY17 Q3 FY17 Q4 FY17 2.3x 2.4x 2.7x 3.8x 3.3x 3.5x Q4 FY16 Q3 FY17 Q4 FY17 Debt/Equity Net Debt/LTM EBITDA
Competitive market position
turbochargers; leadership in hydraulic gear pumps market for over 35 years
structures and aerospace components. Tier I supplier to the global aerospace OEMs such as Airbus, Boeing, Bell Helicopters and HAL
performance critical components such as turbochargers and exhaust manifolds and has capabilities to develop automotive components on single-source basis
the automotive, hydraulic, aerospace and defense industries
selective acquisitions Diversified business
global auto OEM hub
Bristol, UK’s south west aerospace hub Locational advantages
16
R&D and Intellectual Property
India
captive use
manufacturing highly intricate castings
Bristol) and Germany (Schwarzenberg) Vertically Integrated Facilities Blue Chip Customers
Holland Fiat , Same Deutz-Fahr
Aerosystems
Board and Management
17
AUTOMOTIVE
59% of Q4 FY17 Revenue
automotive components including engine, transmission, turbocharger and chassis parts
aluminium castings HYDRAULICS
18% of Q4 FY17 Revenue
packages
AEROSPACE & DEFENCE
23% of Q4 FY17 Revenue
wing flaps and major airframe structures
18
Deere
Mahindra
Fiat
Fahr
Shareholders Sep-16 Dec-16 Mar-17 Promoters 51.1% 50.3% 50.2% FIIs 14.5% 14.5% 14.7% DIIs 12.4% 13.1% 13.1% Others 22.1% 22.1% 22.0% Total 100.0% 100.0% 100.0%
Year Event Equity Capital (Rs. mn) 1974 Initial Public Offering 2.9 1987 Rights Issue 11.2 1992 Rights Issue 21.0 1994 Rights Issue 31.5 1995 Bonus Issue 41.9 2008 Amalgamation 48.1 2008 Qualified Institutional Placement 54.1 2014 Preferential convertible warrants 60.4 2014 Qualified Institutional Placement 63.4
19
Promoters 50.2% FIIs 14.7% DIIs 13.1% Others 22.0%
20
Profit & Loss Statement (Rs. million) FY16 FY17 Revenues Net Sales / Income from Operations (Net of Excise Duty) 14,806 14,957 Other Operating Income 132 120 Total Revenues 14,938 15,078 Expenses Cost of Raw Materials Consumed 8,502 8,459 Changes in Inventories of Finished Goods, WIP and Stock in Trade (111) (79) Employee Benefit Expenses 2,192 2,300 Other Expenditure 2,945 2,744 Total expenses 13,527 13,424 Operating Profit (EBITDA) 1,410 1,653 Depreciation and Amortization Expenses 524 544 EBIT 886 1,109 Other Income 50 59 Finance Costs 727 741 PBT – Pre Exceptional 208 428 Exceptional (Gain)/ Losses 101 PBT 208 327 Tax Expenses 86 181 PAT 122 146 Basic EPS (Rs) 19.36 23.02 Margins (%) Gross Margins 43.8% 44.4% EBITDA margins 9.4% 11.0% PAT margins 0.8% 1.0% Y-o-Y Growth (%) Total Revenues 0.9% EBITDA 17.2% PAT 19.0%
21
Balance Sheet (Rs. million) Mar-16 Mar-17 ASSETS Non-Current Assets Goodwill 936 826 Fixed Assets 5,617 5,896 Non-Current Investment 1 7 Deferred tax asset (net) Long Term Loans and Advances 260 254 Other Non Current Assets 78 62 Total Non-Current Assets 6,892 7,046 Current Assets Inventories 2,561 2,574 Trade Receivables / Sundry Debtors 1,228 1,519 Cash and Cash Equivalents 677 826 Short-Term Loans and Advances 356 410 Other Current Assets 111 120 Total Current Assets 4,933 5,450 TOTAL ASSETS 11,825 12,495 22
Balance Sheet (Rs. million) Mar-16 Mar-17 EQUITY and LIABILITIES Shareholders Fund Share capital 63 63 Reserves and surplus 2,513 2,401 Money Received against Share Warrants Non-controlling interest (Preference capital) Total Shareholders Fund 2,576 2,464 Non-Current Liabilities Long-Term Borrowings 3,999 4,686 Deferred Tax Liabilities (net) 253 232 Other Long Term Liabilities 15 12 Long Term Provisions 80 98 Total Non-Current Liabilities 4,347 5,027 Current Liabilities Short-Term Borrowings 920 1,559 Trade Payables 2,402 2,434 Other Current Liabilities 1,457 866 Short-Term Provisions 123 145 Total Current Liabilities 4,902 5,004 TOTAL EQUITY AND LIABILITIES 11,825 12,495 23
24