
SLIDE 1
Page 1
Beam Sensor Models
Pieter Abbeel UC Berkeley EECS
Many slides adapted from Thrun, Burgard and Fox, Probabilistic Robotics
2
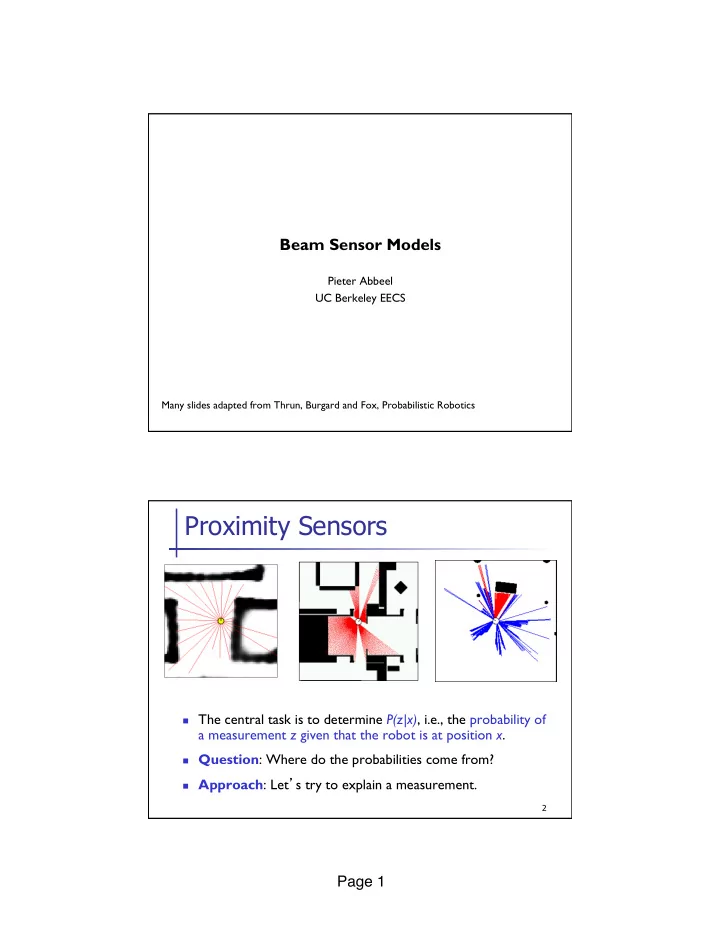
Proximity Sensors
n The central task is to determine P(z|x), i.e., the probability of
a measurement z given that the robot is at position x.
n Question: Where do the probabilities come from? n Approach: Let’s try to explain a measurement.