
SLIDE 1
1
Structural Systems Biology: Modelling Protein Interactions and Complexes
Patrick Aloy
BWS – Feb ‘07
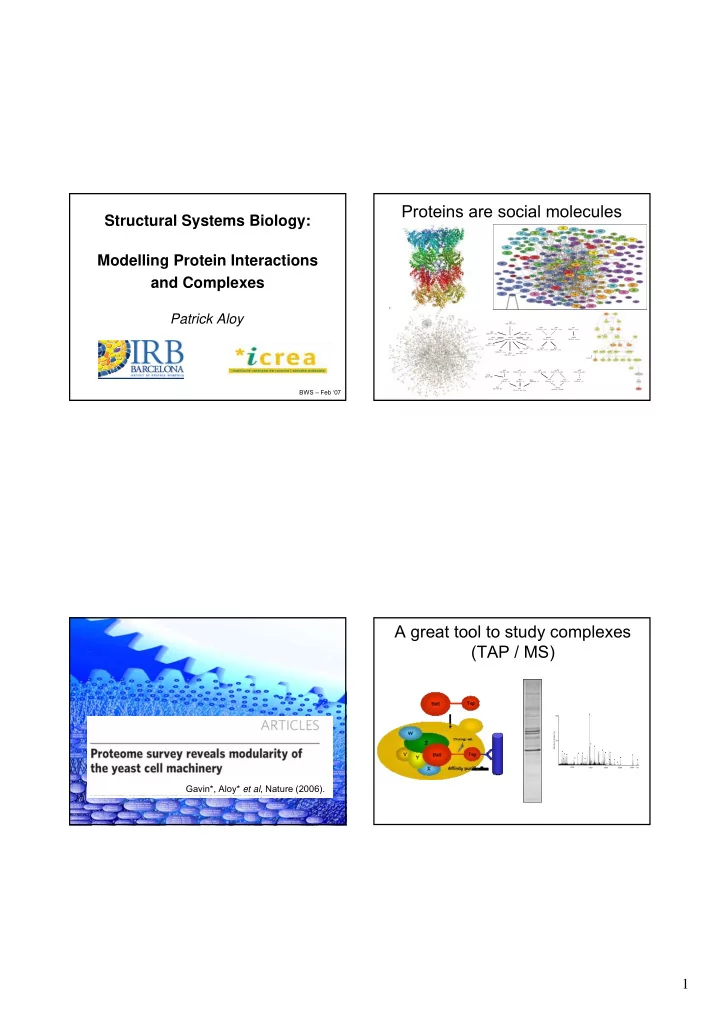
Proteins are social molecules
ccl1 YPR025C - cyclin kin28 YDL108W - pkinase cdc28 YBR160W - pkinase cks1 YBR135W - CKS cln1 YMR199W - cyclin cln2 YPL256C - cyclin clb2 YPR119W - cyclin clb4 YLR210W - cyclin clb3 YDL155W - cyclin clb5 YPR120C - cyclin cln3 YAL040C - cyclin clb6 YGR109C - cyclin clb1 YGR108W - cyclin pho85 YPL031C - pkinase pcl1 YNL289W - cyclin pcl2 YDL127W - cyclin pcl1 YDL179W - cyclin pcl5 YHR071W - cyclin † † † I cdc42 YLR229C - ras ste20 YHL007C - PBD gic2 YDR309C - PBD cla4 YNL298W - PH rdi1 YDL135C - Rho_GDI gsp1 YLR293C - ras yrb2 YIL063C - Ran_BP1 ras1 YOR101W - ras sdc25 YLL016W - RasGEF cdc25 YLR310C - RasGEF ras2 YNL098C - ras rho1 YPR165W - ras sac7 YDR389W - RhoGAP rho4 YKR055W - ras ira2 YOL081W - RasGAP † mge1 YOR232W - GrpE ssc1 YJR045C - HSP70 act1 YFL039C - actin pfy1 YOR122C - profilin spt15 YER148W - TBP TF III B YGR246C - transcrript _fac2 † vam3 YOR106W - Syntaxin sed5 YLR026C - Syntaxin vps45 YGL095C - Sec1 sly1 YDR189W - Sec1 vps33 YLR396C - Sec1 tlg2 YOL018C - Syntaxin IGavin*, Aloy* et al, Nature (2006).
A great tool to study complexes (TAP / MS)
50 100 Relative Intensity [%] 1000 1500 2000 2500 3000 m/z M* *
- M