
SLIDE 1
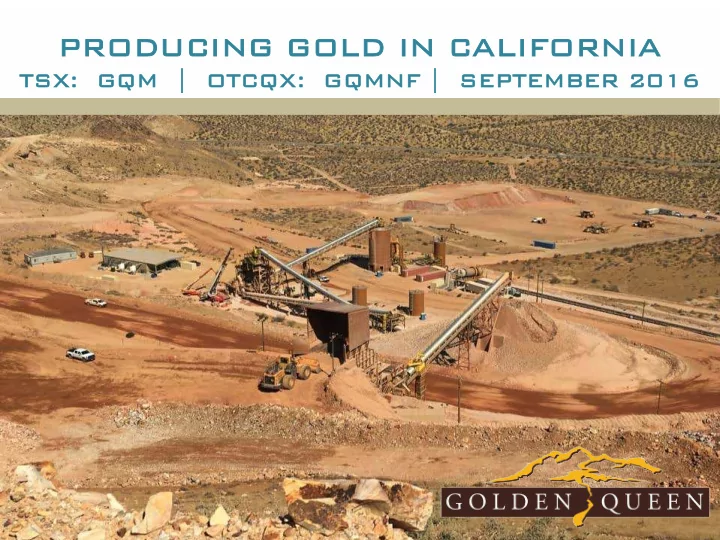
PRODU DUCING G GOL OLD IN CAL ALIFOR ORNIA TSX: X: GQM QM | - - PowerPoint PPT Presentation
PRODU DUCING G GOL OLD IN CAL ALIFOR ORNIA TSX: X: GQM QM | | OT OTCQX: CQX: GQMN QMNF | | SEPTEMB MBER 2016 2016 Cau Caution tionary ry S Statem temen ents ts The information in this presentation prepared for the Denver
The information in this presentation prepared for the Denver Gold Forum includes certain “forward-looking information” and “forward-looking statements” within the meaning of section 27A of the Securities Act of 1933 (as amended), section 21E of the Securities Exchange Act of 1934 (as amended), the United States Private Securities Litigation Reform Act of 1995 and applicable Canadian securities legislation. All statements, other than statements of historical fact, included herein including, without limitation, plans for and intentions with respect to our properties, statements regarding intentions with respect to the Soledad Mountain project’s (the “Project”) current and future operating or financial performance including production, rates of return, recoveries, and operating costs are forward-looking statements. Statements concerning Mineral Reserve Estimates and Mineral Resource Estimates are also forward-looking statements in that they reflect an assessment, based on certain assumptions, of the mineralization that would be encountered and mining results if the Project was mined in the manner described. Forward-looking statements involve various risks and
future events could differ materially from those anticipated in such statements. Important factors that could cause actual results to differ materially from statements in this presentation regarding our intentions include, without limitation, risks and uncertainties regarding: the operation of the Project, including additional capital requirements for the Project or future acquisitions; unexpected liabilities of changes in the cost of operations, including costs of extracting gold and silver; refining costs; operating hazards and risks inherent in mining
laws or regulations in the United States or California; the ability of Golden Queen Mining Company, LCC to obtain and maintain licenses, access rights or permits, required for current and future planned operations; unexpected uninsurable risks that may arise; risks associated with any future hedging activities; equipment breakdowns and non-compliance with environmental and permit requirements. Other risks and uncertainties include risks related to volatility in global equities, commodities, foreign exchange, market price of gold and silver and a lack of market liquidity; changes in planned work resulting from logistical, technical or other factors; that results of
silver resources and reserves; and other risks and uncertainties disclosed in the section entitled "Risk Factors“ contained in our Annual Report on Form 10-K for the year ended December 31, 2015. Forward-looking statements are based on numerous assumptions and are subject to all of the risks and uncertainties inherent in our business, including risks inherent in mining. Investors are cautioned that forward- looking statements are not guarantees of future performance and, accordingly, should not to put undue reliance
information currently available. Technical information in this presentation was reviewed and approved Sean Ennis,
2
Capital Structure – September 2016
Listings TSX: GQM | OTCQX: GQMNF Shares Issued & Outstanding 111,048,683 Options 1,070,000 Warrants (non-listed) 10,757,700 Warrants (GQM.WT) 5,560,000 Fully Diluted Shares 128,536,383 Market Cap (Basic) US$104.5 MM | C$135.75 MM Cash * US$23.3 MM Debt ** US$48.7 MM Enterprise Value US$130.0 MM Insiders Ownership ~30.0% Institutional Ownership ~16.0% Public Float ~54.0% * Cash (August 9, 2016) comprised of US $16.3 mm 100% attributable
to Golden Queen Mining Ltd. and 50% of Golden Queen Mining LLC’s cash balance of US$13.9 mm. ** Debt (August 9, 2016) comprised of US$40.6 mm loan and 50% of Komatsu loan (~US$16.2 mm).
3
Top Shareholders*
Clay Family 30% Sprott Asset Management L.P. 6% Continental Casualty 3% Gabelli Funds LLC 3% *Source: TSX Infosuite
4
ieve 10,000 000 to to 12, 12,000 000 to ton per per day th through ghput
xpan and H Heap ap Le Leac ach pad ad c cap apac acity
poten tentia tial f for res esource in e increa ease with ith ex expl ploratio tion d dril illin ing
drilling ng prog rogram in n East t Pit it to to optim ptimiz ize e min inin ing g for th the e next 5 ext 5 yea ears
5
California’s oil production (California is the 3rd largest oil producing state in the U.S., behind Texas and North Dakota)
~90 miles northeast of the Los Angeles International Airport
and an existing paved County road, Silver Queen Road
within ~1 mile of the Project
town of Mojave
Northern and Union Pacific railroad lines
Excellent infrastructure nearby: paved road, power, water, railroad
Calif ifornia ia
Tow
Moj Mojave ve & & Highway Lar arge win wind farm rm
Sol
dad M d Mou
ntain n Pr Project ct
So Sola lar pa panels Produc ucti
water er wel ell Pow
er line t e to
te
6
4 East Pit Mining through early 2022 Main Pit Mining until Q2 2017 North West Pit Mining until Q4 2017
Min Minin ing g No North th-Wes est P t Pit it Heap ap Le Leac ach P Pad ad & Mer Merril ill-Crow Crowe P Plant Crushin ing-Scre reeni ning ng Plan ant & As Assay Labor
ry
8
Lookin ing E East
Pr Primary Ja Jaw w Crusher er Secon
dary ry Cone Cone Cru Crusher As Assay Labor
ry Coa Coars rse Ore Ore Sto tockpil pile
9
Stage ge 1 1 Phase 1 e 1 Heap ap Le Leac ach P Pad ad Mer Merril ill-Crow Crowe Plan ant & Over verflow Pond
Gr Grasshoppe pper Conv Conveyors rs Conv Conveyor f r from rom Crushin ing-Scre reeni ning ng Plan ant Aggl Agglomer erate ted Ore e
the e Pad
10
Q3 3 PRO ROGR GRESS TO TO DATE TE
A total of 272K tons of ore was mined in July with a strip ratio of 1.6:1 waste to ore; July production was 2,905 ounces of gold and 29,284 ounces of silver poured
In August, 311K tons of ore was mined with a strip ratio of 2.1:1 waste to ore; August production was 2,147 ounces of gold and 26,087 ounces of silver poured
Daily average throughput increased from 8.7K in June to 9.4K in August
Cell 1 estimated 150-day recovery of approximately 70% to 75%, and anticipated 350-day recovery of approximately 82%
Anticipated steady state production and positive operating cash flow in H2 2016
11
Q2 2016 2 2016 Ore Tons Mined (t) 660,000 Strip Ratio (W:O) 1.8:1 Gold Production (oz) 2,827 Silver Production (oz) 33,346 Gold Grade Processed (oz/t) 0.013 Silver Grade Processed (oz/t) 0.40 Site Operating Costs ($/t) $11.94
12
MDA modeled a total of 1.9 million tons as high-grade vein ore mined by earlier underground operators including Gold Fields American Development Company (“Gold Fields”) prior to 1942. These volumes are therefore not included in the reported resources. Total historical production at Soledad Mountain has been estimated at 1.3 million tons, although detailed production records are not
underestimates the amount of high-grade vein material that remains in place. Channel samples included in the Project database consist entirely of cross-cut samples; none of the samples taken along the strike of the mineralized structures were transcribed from original Gold Fields maps into the Project database. The inclusion of the drift-sample data would increase the accuracy of the modeling of the high-grade portions of the mineralized structures, which could further enhance the grade of the resources.
13
leach operation is in full production, based on the location of the Project in Southern California (proximity to major highways and railway lines).
stockpiled for this purpose. The waste rock can be classified into a range of products such as riprap, crushed stone and sand with little further processing.
certain kinds of aggregates. Testing of current mine rock is underway.
the southern California aggregates markets annually.
projections until long term contracts for the sale of products have been secured.
14
Thomas s M. C Clay ay
Chairman man & & CEO EO
served on the Golden Queen Mining Co. Ltd. Board since 2009
.
Robert ert C
alish, , Jr.
CO COO
and is the former General Manager of SCM Franke Operation of KGHM International in Chile
Arizona, Alaska, South Carolina, Montana & Nevada and received his Bachelor
degree from the University of Wisconsin
Bry Bryan an A. Coa Coates
Di Dire rector
President, Finance and Chief Financial Officer of Osisko Mining Corp. with over 30 years of experience in the international and Canadian mining industry
NioGold Mining Corporation and the Quebec Mining Association
Gu Guy y Le e Bel Bel
Di Dire rector
director of RedQuest Capital with more than 30 years of international mining experience in strategic and financial planning
Ber Bernard rd Guarn arnera
Di Dire rector
President, Mining & Metallurgical Society of America, Current director, Colorado Mining Association and Broadlands Mineral Advisory Services Ltd. with 40+ years of experience in the global mining industry
Andrée S ée St- Germa rmain in
Vice P e President ent Finance ce & C & CFO FO
and construction of the Project
with mining companies on a variety of financings and M&A advisory assignments
15
and silver in California
positive cash flows
jurisdiction with existing infrastructure
project economics
with budget
GQ
16
In September 2014, Golden Queen Mining Co.
LLC, whereby Gauss LLC invested US$110 million in cash in exchange for a 50% joint venture interest in the Soledad Mountain Project.
Leuc ucadi dia Nat ational al Corp. is a NYSE- listed diversified holding company engaged in a variety of businesses, including investment banking and capital markets, beef processing, asset management, commercial mortgage banking and servicing, manufacturing, auto dealerships, telecommunications, oil & gas, energy projects and real estate. The company has a history of successful investments in the mining sector. Au Auve verg rgne LLC LC is a wholly-owned entity
long-term, supportive shareholders
1980’s, the Clay family and associated entities have provided significant equity and debt capital to Golden Queen to help fund the exploration and development of the Soledad Mountain Project. Thomas Clay, Manager
Auvergne, has served on the Golden Queen board since 2009 and was appointed Chairman in 2013
Gauss LLC JOINT VENTURE Golden Queen Mining Company, LLC Golden Queen Mining Holdings Inc. Golden Queen Mining Co. Ltd.
100% Interest 50% Interest
Auvergne LLC Leucadia National Corp. (Gauss Holdings LLC)
50% Interest 70.5% Interest 29.5% Interest
Soledad Mountain Project
100% Interest
Auvergne
LLC
18
Gold mining on Soledad Mountain dates back to the late 19th century. The largest producer in the area was Gold Fields American Development Co., a subsidiary of Consolidated Gold Fields of South Africa. This syndicate operated an underground mine and mill on the property from 1935 to 1942, when the mine was forced to close by War Production Board Order L-208. Production after the war was minimal, as costs had increased while the price of gold remained fixed at $35 per ounce until 1973. The Soledad Mountain deposit is a large, epithermal, multi-episodic, fault/fissure vein system. Gold and silver mineralization occurs in low sulfidation, quartz adularia veins and stockworks that strike northwest. At least 14 separate veins and related vein splits have been identified. Core veins range from less than 1 metre to 6 metres wide with gold grades typically greater than 3.5 grams per ton, surrounded by lower grade mineralization with widths ranging from 1 metre to greater than 50 metres. The level of oxidation extends to depth and the deposit is well-suited for heap leaching.
Karma Headframe and Mill (Circa 1912) 19
Soledad Mountain is located within the Mojave structural block, a triangular-shaped area bounded to the south by the northwest-trending San Andreas Fault and to the north by the northeast-trending, Garlock Fault. The Mojave block is broken into an orthogonal pattern of N50E to N60E and N40W to N50W fracture systems. These fracture zones likely developed as the result of Late Cretaceous compressional stresses that were present prior to formation of the Garlock and San Andreas Faults. Gold and silver mineralization at Soledad Mountain is hosted by northwest-trending, en-echelon faults and fracture systems. Cretaceous quartz monzonite forms the basement of stratigraphic sequences in the Mojave block. The quartz monzonite is overlain by Miocene-age, quartz latite and rhyolitic volcanic rocks. Volcanic centers appear to have formed at intersections of the northeast and northwest-trending fracture systems. Major volcanic centers are present at Soledad Mountain, Willow Springs and Middle Buttes. These volcanic centers consist generally of initial, widespread sheet flows and pyroclastics of quartz latite, followed by restricted centers of rhyolitic flows and rhyolite porphyry intrusives. Rhyolitic flows and intrusives are elongated somewhat along northwest-trending vents and feeder zones. Gold deposits in the Mojave block include Soledad Mountain, Standard Hill, Cactus and
veins and stockworks that strike northwest. Gold mineralization at Standard Hill, located 1 mile northeast of Soledad, consists of north to northwest-striking quartz veins in Cretaceous quartz monzonite and Tertiary, quartz latite volcanic rocks. At the Cactus Gold Mine, 5 miles west of Soledad, gold occurs in northwest and northeast-striking quartz veins, breccias and irregular zones of silicification in quartz latite, rhyolitic flows and rhyolitic intrusive breccias. At least 14 separate veins and related vein splits occur at Soledad Mountain. Veins generally strike N40W and dip at high angles either to the northeast or to the southwest. Mineralization consists of fine-grained pyrite, covellite, chalcocite, tetrahedrite, acanthite, native silver, pyrargyrite, polybasite, native gold and electrum within discrete quartz veins, veinlets, 20
industry are from ThyssenKrupp/Polysius
HPGRs for over 25 years
Th The HP HPGR in GR in in indus ustry
hundreds of projects world-wide
roll and the other a “floating” roll. The “floating” roll is mounted on and can move freely on slides and grinding forces are applied by four hydraulic rams Benef enefits of usin using t g the HP HPGR w GR wil ill in include:
the flow rate of solutions through the heap
screening plant that uses cone crushers and screens to size ore for leaching in a heap leach operation
the crushing-screening plant
costs than a conventional crushing-screening plant
Ter ertia tiary S Sec ectio tion High High Pres essure Gr Grin indin ing g Roll (HP (HPGR GR)
21
Gold Silver Classification Tonnes Ton g/t
g/t
Measured 4,298,243 4,738,000 0.960 0.028 13.37 0.39 130,000 1,865,000 Indicated 79,237,167 87,344,000 0.549 0.016 9.26 0.27 1,415,000 23,733,000 Measured & Indicated 83,535,409 92,082,000 0.575 0.017 9.53 0.28 1,545,000 25,598,000 Inferred 21,392,329 23,581,000 0.343 0.010 7.20 0.21 245,000 4,965,000 Gold Silver In-Situ Grade Contained Metal Gold Silver Classification Tonnes Ton g/t
g/t
Proven 3,357,000 3,701,000 0.948 0.028 14.056 0.410 102,300 1,517,100 Probable 42,957,000 47,352,000 0.638 0.019 10.860 0.317 881,300 14,999,100 Total & Average 46,314,000 51,053,000 0.661 0.019 11.092 0.324 983,600 16,516,200 In-Situ Grade Contained Metal Gold Silver
Ca Caution
note to to U.S. inve nvestors conc ncer erni ning ng mea easured ed, in indic icated or
ferred ed resour sources: We advise U.S. investors that while the terms “measured resources”, “indicated resources” and “inferred resources” are recognized and required by Canadian regulations, the U.S. Securities and Exchange Commission does not recognize these terms and these terms do not comply with SEC Guide 7 requirements. Investors are cautioned not to assume that any part or all of the material in these categories will be converted into reserves. It should not be assumed that any part of an inferred mineral resource will ever be upgraded to a higher category. Ca Caution
note to to U.S. inves vestors concer erni ning ng proven ven or
le miner neral res eser erve ve es estimates es: This slide uses the terms “proven reserves” and “probable reserves” in accordance with NI 43-101. We advise U.S. investors that the requirements of NI 43-101 for identification of “reserves” are not the same as those of the SEC, and reserves reported by the Company in compliance with NI 43-101 may not qualify as “reserves” under SEC Guide 7 standards. Accordingly, information concerning mineral deposits set forth herein may not be comparable with information presented by companies using only U.S. standards in their public disclosure.
who is employed by Norwest Corporation.
used for all other rock types. Cut-off grade was varied to reflect differences in estimated metal recoveries for the different rock types mined.
term Au:Ag price ratio of 55 and a Au:Ag recovery ratio of 1.6.
in grams per tonne.
Development Associates, Inc.,
and heap-leach processing.
term Au:Ag price ratio of 55 and a Au:Ag recovery ratio of 1.6.
metal content.
grams per tonne.
(100% Basis is)
Key ey P Paramete ters 2015 2015 Fea easibil ibility ity Stu tudy
Estimated Mine Life (Years) 11.3 Average Throughput (k short tons per year) 4,594 Stripping Ratio (waste tons:ore tons) 3.41:1 Au Recovery (%) 82.1% Ag Recovery (%) 50.0% Total Au Production (k oz) 807.4 Total Ag Production (mm oz) 8.3 Average Annual Au Production (k oz) (Year 2 – Year 11) 74 Average Annual Ag Production (k oz) (Year 2 – Year 11) 781
incorporates the revised reserves.
completed on a quarterly basis for the life of the mine.
estimate has been included in the mine plan. Successful infill drilling and expanding the Approved Project Boundary may allow us to significantly increase the mine life.
23
Base Case Economics (1) 2015 Feasibility Study Pre-Tax NPV 5% $289.5 mm Pre-Tax IRR 32.7% After-Tax NPV 5% $213.9 mm After-Tax IRR 28.3% Operating Costs 2015 Feasibility Study Mining Costs per Tonne Mined $1.17/t Mining Costs per Tonne of Ore Processed $5.18/t Processing Costs per Tonne of Ore Processed $4.10/t Site G&A per Tonne of Ore Processed $0.72/t Oper perating ng C Costs per per Tonne o nne of O Ore Pr e Proces cessed ed $9.99/ 99/t Total Cash Costs, Net of Silver By-Product (1)
(2)
$518 $518/oz
Total Cash Costs, Net of Silver By-Product + Susex (1) (2) (3) $558 $558/oz
(1) Base case done with a gold price of $1,250/oz and a silver price of $17/oz. $25.4mm spent prior to December 31, 2014 has been excluded from economics. (2) Includes royalties, property taxes, California fees, off-site refining charges, reclamation financial assurance. (3) Sustaining capex includes additional mobile mining equipment acquired between Year 2 and Year 10.
following items: cyanide, cement, power, labour, fuel) have been brought current
quartile cash cost
Li Life fe of M Mine ne Ca Capital Cos Costs 2015 2015 Feasibi asibility St Study ( (US$ US$) Pre-production Capital Costs $99.3 mm Contingency $15.0 mm Working Capital $10.0 mm Financial Assurance Estimate $0.5 mm Mobile Mining Equipment $19.2 mm Tota tal P Pre-Producti tion
$144 $144.0 m mm Sustaining Capital Costs $25.5 mm Additional Mobile Mining Equipment (Years 2-10) $10.9 mm Total L Life o e of Mine ne Capi pital Cos Costs $180 $180.5 mm mm
with the capital costs update provided in March 2014.
$12.5mm to the joint venture in June 2015 to maintain its 50% interest in the Project.
the project as on budget.
25
$127.2 $170.8 $213.9 $256.5 $298.2 Au $1,050 / Ag $15 Au $1,150 / Ag $16 Au $1,250 / Ag $17 Au $1,350 / Ag $18 Au $1,450 / Ag $19
Feasibility Study Base Case
After-tax IRR(1) After-tax NPV (5%)(1)
US$ MM 19.7% 24.2% 28.3% 32.3% 36.0% Au $1,050 / Ag $15 Au $1,150 / Ag $16 Au $1,250 / Ag $17 Au $1,350 / Ag $18 Au $1,450 / Ag $19
Figures shown on a 100% basis
(1) $25.4mm in capital expenditures spent prior to December 31, 2014 has been excluded from economics.
26
A detailed review of approvals and permits required for the Project is provided in the Company’s latest Form 10-K filing with the U.S. Securities and Exchange Commission, dated March 16, 2015. The following is therefore only a brief summary. Condit itio ional Us Use Pe Permi mits
appeals that were subsequently filed against the Commission’s decision have been withdrawn and the decision made by the Planning Commission is now final. The Planning Commission approved minor wording changes to the Conditions of Approval on October 28, 2010
approved for the Project. The Company recently addressed the conditions precedent to the start of construction as required by the Conditional Use Permits Waste te Dis isch charge Requ equirem rements
Requirements and a Monitoring and Reporting Program for the Project at a public hearing held in South Lake Tahoe on July 14, 2010
effect Autho Authority to to Constr truc uct an and Pe Permit mit to to Op Operate
County Planning Department and the Eastern Kern Air Pollution Control District (“EKAPCD”) on July 21, 2009. This study was approved by Kern County Planning Commission on April 8, 2010, as part of the certification of the Supplemental Environmental Impact Report
The Authority to Construct permits were issued by EKAPCD on February 8, 2012.
been completed and subject to inspection by EKAPCD
27