
SLIDE 1
1
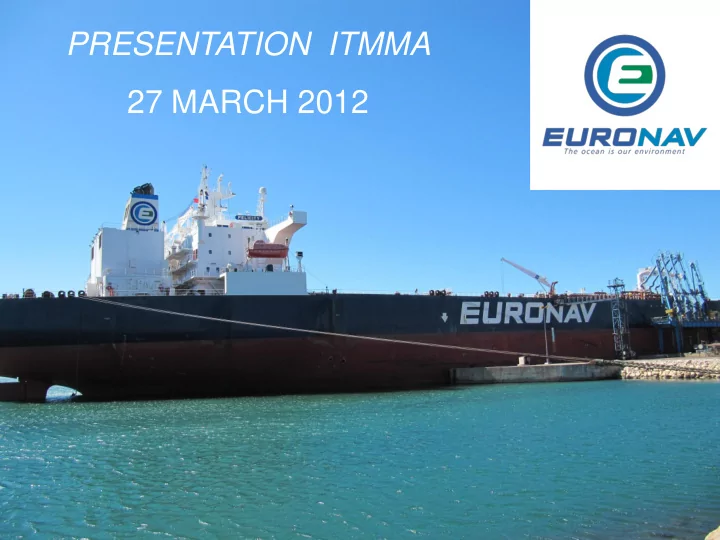
PRESENTATION ITMMA PRESENTATION ITMMA 27 MARCH 2012 27 MARCH - - PowerPoint PPT Presentation
PRESENTATION ITMMA PRESENTATION ITMMA 27 MARCH 2012 27 MARCH 2012 1 AGENDA 1. Key facts 2. Strategy 3. Market Demand Supply 4. Q&A 2 1. Key Facts 3 Public company with solid reference Shareholders EURONAV Stock
1
2
3
4
EURONAV
Stock Exchange: EURONEXT Ticker: EURN Bloomberg: EURN BB Reuters: EURN.BR
SAVERYS – LIVANOS Families 39.29% -- 20.97% Free Float 36.36%
Vessel Type Cargo intake / vessel Euronav owned TC-IN (Weighted) World Fleet
FSO 3 m bls 2 x 50% 101 V-PLUS 3.2 m bls 1 2 VLCC 2 m bls 12 (2 CSR)
11+ (2 x 1/2 in J/V)
6 incl. JV (weighted 3,15) 571 New Building VLCC 2 m bls
SUEZMAX 1 m bls 22 (16 ice class) 445 New Building Suezmax 1 m bls 1 (CSR) 64
6
7
Break-even OPEX VLCC $ 28,500 $ 9,600 Suezmax $ 23,500 $ 7,500
1,689 14% 4,639 37% 6,148 49% fix fix/ps spot
8
9
(demurrage,scheduling,…)
10
GC Tankers
Athenian Sea Carriers Overseas Shipholding Group
Oak Maritime (HK) Reederei “Nord” Euronav DHT Holdings, Inc
2,735,679 dwt 638,187 dwt 3,679,703 dwt 610,439 dwt 1,269,764 dwt 605,438 dwt 912,891 dwt
12
Type V-Plus
Size: 442,893 dwt (FSO Asia) 441,655 dwt (FSO Africa) Owners: Joint venture between OSG and Euronav Storage capacity: 2,800,000 barrels per vessel Location: Al Shaheen Offshore Qatar (FSO Asia) Al Shaheen Offshore Qatar (FSO Africa) Lease period: 8 years until March 2017 (FSO Asia) 3 years until August 2013 (FSO Africa)
13
14
$0 $20,000 $40,000 $60,000 $80,000 $100,000 $120,000 $140,000 $160,000
Jan 08 Jan 09 Jan 10 Jan 11 Jan 12
TCE
World Fleet VLCC Earnings (TCE)
BDTI VLCC TCE (avg of TD1 and TD3) TI VLCC Database TI Actual
15
Source: Clarkson Research Services Limited
50,000 100,000 150,000 200,000 250,000 TCE per day
VLCC Average Earnngs Modern USD/Day
16
Source: Clarkson Research Services Limited 20,000 40,000 60,000 80,000 100,000 120,000 140,000 160,000 180,000 TCE per day
Suezmax Average Earnings USD/day
17
18
75 80 85 90 1Q00 1Q01 1Q02 1Q03 1Q04 1Q05 1Q06 1Q07 1Q08 1Q09 1Q10 1Q11 mbpd
World Oil Demand in million bpd (Source - IEA)
Source: IEA 75 80 85 90 1Q00 1Q01 1Q02 1Q03 1Q04 1Q05 1Q06 1Q07 1Q08 1Q09 1Q10 1Q11 mbpd
World Oil Production in million bpd (Source - IEA)
Source: IEA
Source: IEA
21
Source: IEA
mbpd Jan '12 Dec '11 Nov '11 Oct '11 Sep '11 North America 14.99 15.04 15.02 14.67 14.34 Europe 3.85 3.85 3.84 3.93 3.63 Pacific 0.55 0.60 0.54 0.52 0.51 Former USSR 13.78 13.68 13.82 13.72 13.67 Asia 7.69 7.76 7.63 7.45 7.55 Latin America 4.30 4.35 4.35 4.25 4.12 Middle East 1.54 1.53 1.49 1.45 1.53 Africa 2.45 2.48 2.50 2.54 2.53 Processing Gains 2.28 2.23 2.23 2.23 2.14 Global Biofuels 1.59 1.68 1.84 1.92 2.18 Total Non-OPEC 53.17 53.35 53.40 52.82 52.34
mbpd 2012 2011 Change % Change North America 14.99 14.54 0.45 3.1% Europe 3.78 3.83
Pacific 0.65 0.52 0.13 25.0% Former USSR 13.80 13.62 0.18 1.3% Asia 7.67 7.67 0.00 0.0% Latin America 4.43 4.21 0.22 5.2% Middle East 1.56 1.64
Africa 2.43 2.52
Processing Gains 2.26 2.17 0.09 4.1% Global Biofuels 1.94 1.84 0.10 5.4% Total Non-OPEC 53.64 52.71 0.93 1.8% United States 8.40 8.10 0.30 3.7% Canada 3.73 3.50 0.23 6.6% Mexico 2.87 2.94
Russia 10.71 10.58 0.13 1.2% UK 1.12 1.12 0.00 0.0% Norway 2.00 2.03
China 4.17 4.13 0.04 1.0% India 0.92 0.90 0.02 2.2% Brazil 2.34 2.19 15.0% 6.8% Total Supply 88.48
24
25
Source: Mees/IEA
26
27
28
VLCC Fleet Development - Base Case
Basis TUKA VLCC Database Fleet at year start DH SH NBs DH Exit SH Exit Total Exit SH to DH Growth Growth % 2007 483 322 161 29 1 21 22 4 7 1.4% 2008 490 354 136 42 3 35 38 3 4 0.8% 2009 494 396 98 53 2 31 33 3 20 4.0% 2010 514 450 64 60 2 42 44 3 16 3.1% 2011 530 511 19 65 6 14 20 1 45 8.5% 2012 575 571 4 52 22 2 24 28 4.9% 2013 603 601 2 59 16 16 43 7.1% 2014 646 644 2 23 16 16 7 1.1% 2015 653 651 2 17 12 1 13 4 0.6% 2016 657 656 1 16 12 12 4 0.6% 2017 661 660 1 20 12 12 8 1.2% 2012YTD 579 575 4 11 7 7 4 0.7% Rest of Year 41 15 2 17 24 4.1% Reference Date: 1 Mar 12
29
Suezmax Fleet Development
Souce: Clarksons Fleet at year start DH SH NBs Total Exit Growth Growth % 2007 343 275 68 25 12 13 3.8% 2008 356 300 56 14 11 3 0.8% 2009 359 313 46 45 15 30 8.4% 2010 389 356 33 41 18 23 5.9% 2011 412 395 17 41 8 33 8.0% 2012 445 436 9 64 64 14.4% 2013 509 500 9 48 48 9.4% 2014 557 548 9 11 11 2.0% 2015 568 559 9 0.0% 2016 568 559 9 0.0% Reference Date: 1 Mar 12
31
Assumption made with cancellations, deferred vessels, vessels converted to FPSO and additional orders.
32
33
34
Source: Clarksons
35
36
37
38
In thousands of USD 2011 2010 2009 2008 2007 2006 REVENUES 394,457 525,075 467,844 858,983 563,136 688,855 EBITDA 128,368 260,298 195,265 658,769 344,027 431,965 EBIT
88,152 31,362 513,896 190,329 288,507 NET PROFIT
19,680
402,469 101,055 218,042 VLCC (TCE) av. 18,100 36,100 33,000 95,700 44,600 65,750 Suezmax TCE av. 27,100 30,600 31,750 41,650 32,200 34,370 Spot Suezmax 15,400 18,000 20,800 Dividend (€) 0.10 0.10 2.60 0.80 1.68 Yield
64% 53%
39
40
In thousands
31.12.2011 31.12.2010 31.12.2009 31.12.2008 31.12.2007 31.12.2006 ASSETS NON- CURRENT ASSETS 2,159,442 2,337,131 2,500,550 2,278,551 2,091,158 2,165,302 CURRENT ASSETS 291,874 307,083 286,116 341,542 182,298 174,892 TOTAL ASSETS 2,451,316 2,644,214 2,786,666 2,621,243 2,274,693 2,340,194 In thousands
31.12.2011 31.12.2010 31.12.2009 31.12.2008 31.12.2007 31.12.2006 LIABILITIES EQUITY 980,988 1,078,508 1,071,629 1,178,326 984,492 1,022,483 NON- CURRENT LIABILITIES 1,221,349 1,314,341 1,463,456 1,181,793 963,340 1,107,555 CURRENT LIABILITIES 248,979 251,365 251,581 261,124 326,861 210,156 TOTAL LIABILITIES 2,451,316 2,644,214 2,786,666 2,621,243 2,274,693 2,340,194