prepared by becky jimenez nsf reu civil infrastructure
play

Prepared by Becky Jimenez NSF REU Civil Infrastructure Engineering, - PowerPoint PPT Presentation

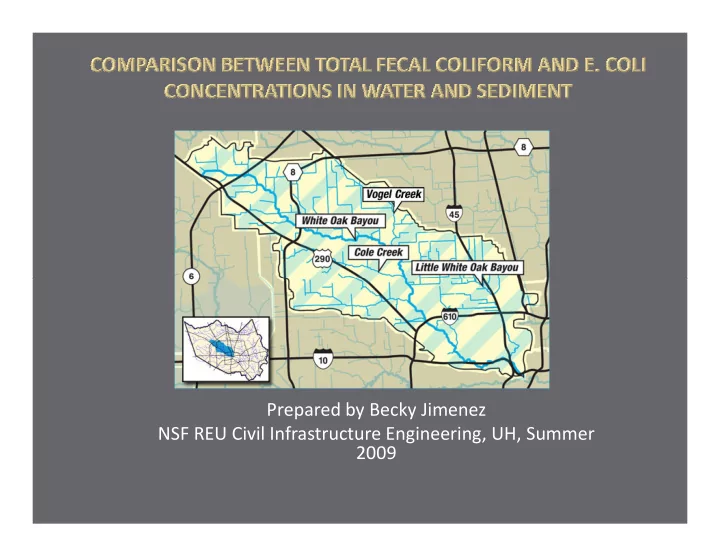
Prepared by Becky Jimenez NSF REU Civil Infrastructure Engineering, UH, Summer 2009 Background and Theory Site Details Bacteria Lab Processing Lab Processing Analysis Conclusion Total Coliform and E.coli


  1. Prepared by Becky Jimenez NSF REU Civil Infrastructure Engineering, UH, Summer 2009

  2. � Background and Theory � Site Details � Bacteria � Lab Processing � Lab Processing � Analysis � Conclusion

  3. � Total Coliform and E.coli concentrations higher in sediment than water Decreasing Sunlight Inactivation o o Protection from predation o Protection from predation o Increased nutrient availability o Colonizable surface

  4. E. COLI � Total Coliforms � Fecal indicator bacteria (FIB) (FIB) E. coli o

  5. YSI READINGS UV READINGS

  6. Lab Lab Processing Processing � Matching samples according to time � Dilutions (Different for Sediment) � Adding reagent � Shaking � Placed into Quanti-trays and Sealed � 24 Hour Incubation at 35 degrees 24 Hour Incubation at 35 degrees Celsius

  7. WATER SAMPLES SEDIMENT SAMPLES

  8. Requirements: • Geometric Mean < 126 MPN/dL • Individual Samples cannot exceed 394 MPN/dL more than 25% of the time 3000 tion (MPN/dL) Geometric Mean 2500 2000 E. coli Concentration 1500 1000 500 0 2002 2003 2004 2005 2009 Years Geometric mean of E. coli concentrations for different years

  9. Samples Samples > 394 Geometric Cole Creek Collected MPN/__ % Exceeding Standard Mean Water (MPN/dL) 24 15 62.5 441 Sediment (MPN/kg) 24 24 100 110470 number of samples over limit % % exceeding exceeding standard standard 100 100 = = × × number total samples evaluated CONCENTRATION IN: TOTAL COLIFORM E. coli SEDIMENT (MPN/kg) Maximum and minimum MINIMUM 238200 7100 E. coli and total coliform concentrations MAXIMUM 24196000 1670000 WATER (MPN/dL) MINIMUM 19177 147 MAXIMUM 61410 2894

  10. TOTAL COLIFORM CONCENTRATION IN WATER CHANGE WITH TIME FLUCTUATION OF TOTAL COLIFORM CONCENTRATION IN SEDIMENT

  11. VARIABILITY OF E. COLI CONCENTRATION IN WATER FLUCTUATION OF E. COLI CONCENTRATION IN SEDIMENT

  12. 800 y = 1245.3e-2.38x R² = 0.666 E. coli concentration 600 400 (MPN/dL) 200 0 6:00 AM 9:00 AM 12:00 PM 3:00 PM 6:00 PM Time Time and E. coli Expon. (Time and E. coli)

  13. Conclusions and Questions

  14. The research study described herein was sponsored by the National Science Foundation under the Award No. EEC-0649163. The opinions expressed in this study are those of the authors and do not necessarily reflect the views of the sponsor. I would also like to thank Dr. Hanadi Rifai, Anu Desai, Sean Carbonaro, Norma Moreno, Scott Rauschhuber, Yaa Amoah, Sharon Wells, Nathan Norma Moreno, Scott Rauschhuber, Yaa Amoah, Sharon Wells, Nathan Howell, Jenni McFarland, Lisa Grecho, Maria Modelska, Stephen Ray, Zack Van Brunt, Matt Feaga and Divagar Lakshmanan.

Download Presentation
Download Policy: The content available on the website is offered to you 'AS IS' for your personal information and use only. It cannot be commercialized, licensed, or distributed on other websites without prior consent from the author. To download a presentation, simply click this link. If you encounter any difficulties during the download process, it's possible that the publisher has removed the file from their server.

Recommend


More recommend