SLIDE 1 Skop
je 14.02.2017.
PREDS EDSTAVLJ VLJANJE ANJE PROJ OJEKT EKTA
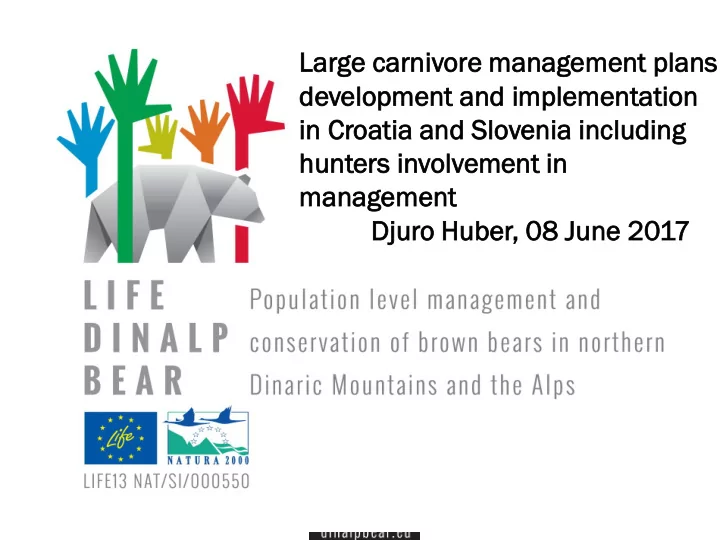
Large ge carniv ivore
gemen ent t pl plans de devel elopm pmen ent t and d impl implem emen entati tation
in in Croati tia and and Sloven enia ia in includi ding hunter ers in involvemen ement t in in manage gement ent Dju juro
er, , 08 June e 2017
SLIDE 2 Skop
je 14.02.2017.
PREDS EDSTAVLJ VLJANJE ANJE PROJ OJEKT EKTA
Durat ation: ion: 5 5 years s (July ly 2014 – June 2019) 4 4 coun untr tries: ies: Sloven enia ia, , Croatia atia, , Itali lia, , Aust ustria ria 9 9 partner tners s Proje
ct leader der Sloven enia ia Fores est t Servic ice Total al value: e: 5.998.048€
SLIDE 3
PROJEC JECT T AREA EA
SLIDE 4
Population ulation level l managem gemen ent t and conser ervation ation Targe rget t - 1
SLIDE 5 Exper ert t modeling ng of different erent scena narios ios of f encroach
ment t in the populati ulation
Common mmon data base se on bear ar populat ation
SLIDE 6
Genetc tc count of be bears
SLIDE 7
SLIDE 8
SLIDE 9
Samp ampling ling set et
SLIDE 10
SLIDE 11
SLIDE 12
SLIDE 13
SLIDE 14
Samples
SLIDE 15 4687 samples es collec llected ed (2472 Sloven enia ia, 2205
5 Croatia ia.
Spatial ial distrib ributi tion
Colle lectors:- mostly HUNT NTERS ERS
00+ people involved.
2 partic ticipa ipants nts deliv livered ered sample les: : 450 50 in Croat atia ia. Colle lectio tion perio iod: d: Septemb mber er – Decem ecembe ber 2017
SLIDE 16 Time me scale ale of resp spon
ses
SLIDE 17 Lab b wo work DNA extrac tractio ion.
SLIDE 18
SLIDE 19 Hunting
- Hunting season: 1 Mar - 15 May & 1 Oct - 15 Dec
- Quota:
(5) 10 (15) % of estimated population
- Hunting methods: from hunting stand next to a feeding site
Supplemental feeding
With food of plant or animal origin
SLIDE 20 b) Gene netic tic monit nitoring ing of dea ead bea ears (effctiv tive popula latio tion size) ze)
Rutinsko genotipiziranje svih mrtvih medvjeda. Nastavlja se u 2017.
SLIDE 21 c) Monit nitoring ing of f popula latio tion trend end and d reprodu
tion n – coun unt t at feed eeding ing sites
BEARS SEEN IN THE SPRING PERIOD, 2004- 2015
Females with cubs 0+ Females with cubs 1+ Cubs 0+ Cubs 1+ Other bears
HRVATSKA SLOVENIjA
SLIDE 22 Croatia – feeding sites
Total number of bears seen
SLIDE 23
SLIDE 24
Croatia - population „census” in 2007 Bear signs - samples
SLIDE 25
Sampling zones with “buffer” of 7.6 km (half diameter of average bear home range): 937.9 km2 Gorski kotar N 1000.3 km2 Gorski kotar S 997.8 km2 Velebit
20 2007.
SLIDE 26
Summary 2007
Collected 547 samples. Genotyped 328 (67% ) Identified 210 individuals Multiple samples for 31 bear (15%)
SLIDE 27
SLIDE 28 Capture - recapture
Problem em too few recaptur ptures es – tot
al 31 of
Should be 2.5 to 3 times more samples than the estimated population size. We had less than 1/3. Therefore big margine of error (SD=22). Obtained values were: Gorski kotar N 133 Gorski kotar S 150 Velebit 136 TOTAL 419 Extrapolation to the whole bear range: Possible 1000 bears s in the whole e range.
SLIDE 29 Rarefraction curve
- br. genotipova
- br. jedinstvenih genotipova
Ratio of total number of genotyped samples and the number of unique individuals Curve should reach plato.
SLIDE 30 Gorski kotar - N
20 40 60 80 10 20 30 40 50
Number of unique genotypes against number of feces analysed
- bserved= circles; mean of observed= black line; Kohn's eq= red line
Number of feces analysed Number of unique genotypes
SLIDE 31
Active e preven ention ion and so solvin ing g of c f conf nflicts licts and damages es Target t - 2
SLIDE 32
Decrease ease of traf affic ic acciden ents ts with h bears Targe rget t - 3
SLIDE 33
„Bear proof” garbage bins
SLIDE 34 Jednosmjerna vrata za izlaz sa autoceste
One One-way y door
N = 1 10
SLIDE 35
N=20
SLIDE 36
Jump-our ramp (N=7)
SLIDE 37
Electric fence next to wire mesh fence 30 km x 2 in bear range
SLIDE 38 Telemetry of bears along the highway. Foot snaring capturing
4 + 4 bea ears marked
SLIDE 41
Over 60 HWY
crossings (tunnels, viaducts) .
SLIDE 42 An Analys yses es of bear r habit itat t and consid nsideri ering ng the e bear ar need ed in sp spatial al plannin ning
Targe rget t - 4
SLIDE 43 Enhaching ching the bear spreadin ding to Alps and d mitigatio igationg ng the related d problems ms
Targe rget t - 5
SLIDE 44
Border fence – new trouble
SLIDE 45 Increasing easing the value of bear in the local space
Targe rget t - 6
SLIDE 46 Work rk with th public ic – promotio tion n and d information rmation
Promotion materials Info – points Media exposure Web page, Facebook, Twitter Schools
SLIDE 47
- Start of long-term cross-border bear management
- Key parameters for population management.
- Promotion of conservation and living with bears.
EXPETED ED RESULTS TS
SLIDE 48
THANKS!