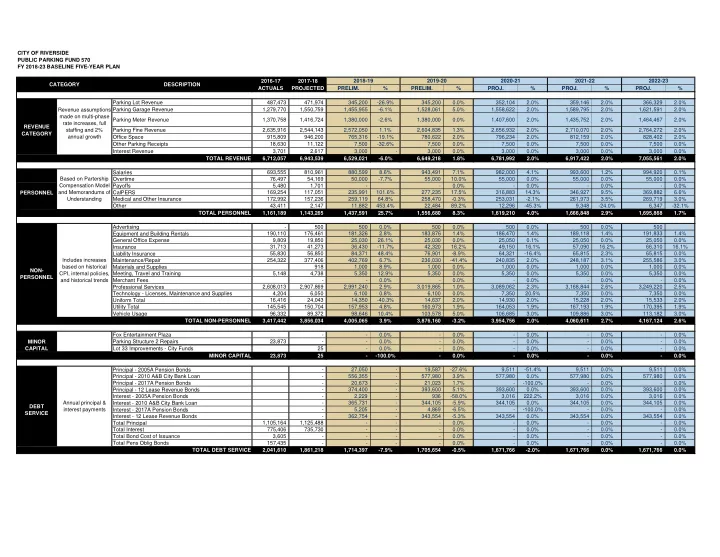

CITY OF RIVERSIDE PUBLIC PARKING FUND 570 FY 2018-23 BASELINE FIVE-YEAR PLAN 2016-17 2017-18 ACTUALS PROJECTED PRELIM. % PRELIM. % PROJ. % PROJ. % PROJ. % Parking Lot Revenue 487,473 471,974 345,200
- 26.9%
345,200 0.0% 352,104 2.0% 359,146 2.0% 366,329 2.0% Parking Garage Revenue 1,279,770 1,550,759 1,455,955
- 6.1%
1,528,061 5.0% 1,558,622 2.0% 1,589,795 2.0% 1,621,591 2.0% Parking Meter Revenue 1,370,758 1,416,724 1,380,000
- 2.6%
1,380,000 0.0% 1,407,600 2.0% 1,435,752 2.0% 1,464,467 2.0% Parking Fine Revenue 2,635,916 2,544,143 2,572,050 1.1% 2,604,835 1.3% 2,656,932 2.0% 2,710,070 2.0% 2,764,272 2.0% Office Space 915,809 946,200 765,316
- 19.1%
780,622 2.0% 796,234 2.0% 812,159 2.0% 828,402 2.0% Other Parking Receipts 18,630 11,122 7,500
- 32.6%
7,500 0.0% 7,500 0.0% 7,500 0.0% 7,500 0.0% Interest Revenue 3,701 2,617 3,000
- 3,000
0.0% 3,000 0.0% 3,000 0.0% 3,000 0.0% TOTAL REVENUE 6,712,057 6,943,539 6,529,021
- 6.0%
6,649,218 1.8% 6,781,992 2.0% 6,917,422 2.0% 7,055,561 2.0% Salaries 693,555 810,961 880,599 8.6% 943,491 7.1% 982,000 4.1% 993,600 1.2% 994,920 0.1% Overtime 76,497 54,169 50,000
- 7.7%
55,000 10.0% 55,000 0.0% 55,000 0.0% 55,000 0.0% Payoffs 5,480 1,701
- 0.0%
- 0.0%
- 0.0%
- 0.0%
CalPERS 169,254 117,051 235,991 101.6% 277,235 17.5% 316,883 14.3% 346,927 9.5% 369,882 6.6% Medical and Other Insurance 172,992 157,236 259,119 64.8% 258,470
- 0.3%
253,031
- 2.1%
261,973 3.5% 269,719 3.0% Other 43,411 2,147 11,882 453.4% 22,484 89.2% 12,296
- 45.3%
9,348
- 24.0%
6,347
- 32.1%
TOTAL PERSONNEL 1,161,189 1,143,265 1,437,591 25.7% 1,556,680 8.3% 1,619,210 4.0% 1,666,848 2.9% 1,695,868 1.7% Advertising
- 500
500 0.0% 500 0.0% 500 0.0% 500 0.0% 500 Equipment and Building Rentals 190,110 176,461 181,326 2.8% 183,876 1.4% 186,470 1.4% 189,118 1.4% 191,833 1.4% General Office Expense 9,809 19,850 25,030 26.1% 25,030 0.0% 25,050 0.1% 25,050 0.0% 25,050 0.0% Insurance 31,713 41,273 36,430
- 11.7%
42,320 16.2% 49,150 16.1% 57,090 16.2% 66,310 16.1% Liability Insurance 55,830 56,850 84,371 48.4% 76,901
- 8.9%
64,321
- 16.4%
65,815 2.3% 65,815 0.0% Maintenance/Repair 254,322 377,406 402,769 6.7% 236,030
- 41.4%
240,835 2.0% 248,187 3.1% 255,586 3.0% Materials and Supplies 918 1,000 8.9% 1,000 0.0% 1,000 0.0% 1,000 0.0% 1,000 0.0% Meeting, Travel and Training 5,148 4,738 5,350 12.9% 5,350 0.0% 5,350 0.0% 5,350 0.0% 5,350 0.0% Merchant Fees
- 0.0%
- 0.0%
- 0.0%
- 0.0%
- 0.0%
Professional Services 2,608,013 2,907,869 2,991,240 2.9% 3,019,865 1.0% 3,089,062 2.3% 3,168,844 2.6% 3,249,220 2.5% Technology - Licenses, Maintenance and Supplies 4,204 6,050 6,100 0.8% 6,100 0.0% 7,350 20.5% 7,350 0.0% 7,350 0.0% Uniform Total 16,416 24,043 14,350
- 40.3%
14,637 2.0% 14,930 2.0% 15,228 2.0% 15,533 2.0% Utility Total 145,545 150,704 157,953 4.8% 160,973 1.9% 164,053 1.9% 167,193 1.9% 170,395 1.9% Vehicle Usage 96,332 89,372 98,646 10.4% 103,578 5.0% 106,685 3.0% 109,886 3.0% 113,182 3.0% TOTAL NON-PERSONNEL 3,417,442 3,856,034 4,005,065 3.9% 3,876,160
- 3.2%
3,954,756 2.0% 4,060,611 2.7% 4,167,124 2.6% Fox Entertainment Plaza
- 0.0%
- 0.0%
- 0.0%
- 0.0%
- 0.0%
Parking Structure 2 Repairs 23,873
- 0.0%
- 0.0%
- 0.0%
- 0.0%
- 0.0%
Lot 33 Improvements - City Funds 25
- 0.0%
- 0.0%
- 0.0%
- 0.0%
- 0.0%
MINOR CAPITAL 23,873 25
- 100.0%
- 0.0%
- 0.0%
- 0.0%
- 0.0%
Principal - 2005A Pension Bonds
- 27,050
- 19,587
- 27.6%
9,511
- 51.4%
9,511 0.0% 9,511 0.0% Principal - 2010 A&B City Bank Loan
- 556,355
- 577,980
3.9% 577,980 0.0% 577,980 0.0% 577,980 0.0% Principal - 2017A Pension Bonds
- 20,673
- 21,023
1.7%
- 100.0%
- 0.0%
- 0.0%
Principal - 12 Lease Revenue Bonds
- 374,400
- 393,600
5.1% 393,600 0.0% 393,600 0.0% 393,600 0.0% Interest - 2005A Pension Bonds
- 2,229
- 936
- 58.0%
3,016 222.2% 3,016 0.0% 3,016 0.0% Interest - 2010 A&B City Bank Loan
- 365,731
- 344,105
- 5.9%
344,105 0.0% 344,105 0.0% 344,105 0.0% Interest - 2017A Pension Bonds
- 5,205
- 4,869
- 6.5%
- 100.0%
- 0.0%
- 0.0%
Interest - 12 Lease Revenue Bonds
- 362,754
- 343,554
- 5.3%
343,554 0.0% 343,554 0.0% 343,554 0.0% Total Principal 1,105,164 1,125,488
- 0.0%
- 0.0%
- 0.0%
- 0.0%
Total Interest 775,406 735,730
- 0.0%
- 0.0%
- 0.0%
- 0.0%
Total Bond Cost of Issuance 3,605
- 0.0%
- 0.0%
- 0.0%
- 0.0%
Total Pens Oblig Bonds 157,435
- 0.0%
- 0.0%
- 0.0%
- 0.0%
TOTAL DEBT SERVICE 2,041,610 1,861,218 1,714,397
- 7.9%
1,705,654
- 0.5%
1,671,766
- 2.0%
1,671,766 0.0% 1,671,766 0.0% 2020-21 2021-22 2022-23 CATEGORY DESCRIPTION REVENUE CATEGORY Revenue assumptions made on multi-phase rate increases, full staffing and 2% annual growth 2018-19 2019-20 NON- PERSONNEL Includes increases based on historical CPI, internal policies, and historical trends PERSONNEL Based on Partership Compensation Model and Memorandums of Understanding MINOR CAPITAL DEBT SERVICE Annual principal & interest payments