Predicting Central Venous Central venous stenosis is a significant - - PDF document

predicting central venous
SMART_READER_LITE
LIVE PREVIEW

Predicting Central Venous Central venous stenosis is a significant - - PDF document

ASDIN 7th Annual Scientific Meeting Background Predicting Central Venous Central venous stenosis is a significant Re-stenosis problem in hemodialysis patients Incidence has been reported 25-40% Amy Dwyer, MD Associate Professor of


slide-1
SLIDE 1

ASDIN 7th Annual Scientific Meeting 1

Predicting Central Venous Re-stenosis

Amy Dwyer, MD

Associate Professor of Medicine Director, Interventional Nephrology University of Louisville

Background

  • Central venous stenosis is a significant

problem in hemodialysis patients

  • Incidence has been reported 25-40%

Kundu, Journal of Vascular Access, 2010 Barrett, Nephrol Dial Transplant. 1988 Schwab, Kidney Int. 1988 MacRae, ASAIO, 2005 Oguzurt, Euro J Radiol, 2005
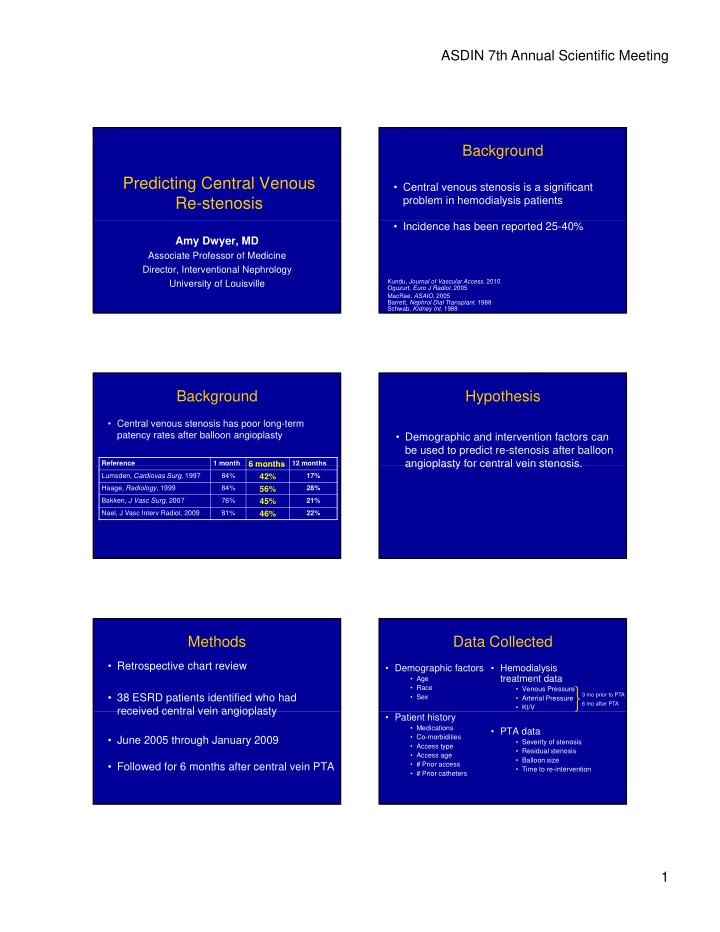
Background

  • Central venous stenosis has poor long-term

patency rates after balloon angioplasty

Reference 1 month

6 months

12 months

6 months

Lumsden, Cardiovas Surg, 1997 84%

42%

17% Haage, Radiology, 1999 84%

56%

28% Bakken, J Vasc Surg, 2007 76%

45%

21% Nael, J Vasc Interv Radiol, 2009 81%

46%

22%

Hypothesis

  • Demographic and intervention factors can

be used to predict re-stenosis after balloon angioplasty for central vein stenosis angioplasty for central vein stenosis.

Methods

  • Retrospective chart review
  • 38 ESRD patients identified who had

received central vein angioplasty received central vein angioplasty

  • June 2005 through January 2009
  • Followed for 6 months after central vein PTA

Data Collected

  • Demographic factors
  • Age
  • Race
  • Sex
  • Hemodialysis

treatment data

  • Venous Pressure
  • Arterial Pressure
  • Kt/V

3 mo prior to PTA 6 mo after PTA

  • Patient history
  • Medications
  • Co-morbidities
  • Access type
  • Access age
  • # Prior access
  • # Prior catheters
  • PTA data
  • Severity of stenosis
  • Residual stenosis
  • Balloon size
  • Time to re-intervention
slide-2
SLIDE 2

ASDIN 7th Annual Scientific Meeting 2

Statistical Analysis

  • Prediction of re-stenosis was evaluated by

cox-proportional hazards analysis.

Patient Demographic Data

Characteristic No Re-stenosis

N= 29, (%)

Re-stenosis

N= 9, (%)

Sex

Male 10 (34.4) Male 6 (66.6)

Age (years)

55.1 54.2

Race

AA 25 (86.2) Caucasian 2 (6.9) Hispanic 1 (3.4) AA 7 (77.7) Caucasian 2 (22.2) Hispanic 0

Arteriovenous fistula

26 (89 6) 5 (55 5)

Arteriovenous fistula

26 (89.6) 5 (55.5)

DM

11 (37.9) 6 (66.6)

HTN

26 (89.6) 9 (100)

Peripheral vascular disease

2 (6.9) 1 (11.1)

Congestive heart failure

7 (24.1) 1 (11.1)

Coronary artery disease

5 (17.2) 2 (22.2)

Cerebral vascular event

1 (3.4) 1 (11.1)

Aspirin

7 (24.1) 3 (33.3)

Clopidogrel

1 (3.4)

Wafarin

3 (10.3) 2 (22.2)

Results

Variable No Re-stenosis (N = 29) Re-stenosis (N = 9) Hemoglobin (gm/dl)

3 months prior to PTA 6 months after PTA 11.0 11.5 12.1 12.2

Venous Pressure (mm Hg)

3 th i t PTA 216 0 247 9

Table 2. Covariates used in analysis of re-stenosis rate

3 months prior to PTA at time of PTA 6 months after PTA 216.0 224.6 234.6 247.9 243.9 226.3

Arterial Pressure (mm Hg)

3 months prior to PTA at time of PTA 6 months after PTA

  • 173.3
  • 193.7
  • 220.3
  • 192.2
  • 203.1
  • 189.7

kt/v

3 months prior to PTA at time of PTA 6 months after PTA 1.57 1.64 1.60 1.61 1.60 1.63

Variable No Re-stenosis (N = 29) Re-stenosis (N = 9) Hemoglobin (gm/dl)

3 months prior to PTA 6 months after PTA 11.0 11.5 12.1 12.2

Venous Pressure (mm Hg)

3 th i t PTA 216 0 247 9

Results

Table 2. Covariates used in analysis of re-stenosis rate

3 months prior to PTA at time of PTA 6 months after PTA 216.0 224.6 234.6 247.9 243.9 226.3

Arterial Pressure (mm Hg)

3 months prior to PTA at time of PTA 6 months after PTA

  • 173.3
  • 193.7
  • 220.3
  • 192.2
  • 203.1
  • 189.7

kt/v

3 months prior to PTA at time of PTA 6 months after PTA 1.57 1.64 1.60 1.61 1.60 1.63

Results

  • Average difference in venous pressure

3 months prior to the initial intervention

  • 216 mmHg in the no re-stenosis group

216 mmHg in the no re stenosis group

  • 248 mmHg in the re-stenosis group (p=0.041)

Figure 1. Kaplan- Meier plot of venous pressure plotted as two groups divided at the mean pressure for all subject. Subjects with a mean venous pressure less than 223 mmHg 3 months prior to the initial intervention had a decreased rate of re-stenosis during the 6 month follow up period (p=0.041).

slide-3
SLIDE 3

ASDIN 7th Annual Scientific Meeting 3

Results

  • If Venous Pressure was < 186 mm Hg, no
  • ne developed re-stenosis.
  • The risk of re-stenosis increased 17% for

The risk of re stenosis increased 17% for every 10 mmHg increase in venous pressure.

Conclusion

  • We conclude that high venous pressure

three months prior to central vein balloon angioplasty is predictive of re-stenosis within 6 months.

Acknowledgements

  • Robert Murithi, MD
  • Anand Patel, MD
  • George Aronoff, MD
  • Michael Brier, PhD