Poultry Breeding Sector Kate Barger, DVM Director of Animal Welfare - - PowerPoint PPT Presentation

poultry breeding sector
SMART_READER_LITE
LIVE PREVIEW

Poultry Breeding Sector Kate Barger, DVM Director of Animal Welfare - - PowerPoint PPT Presentation

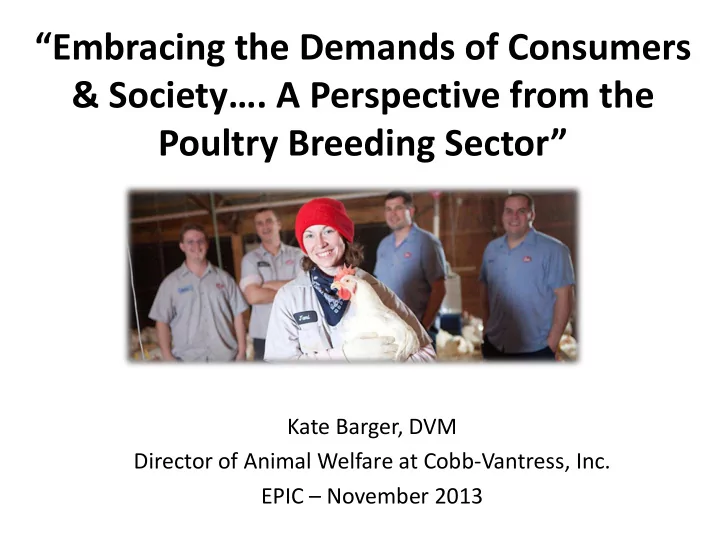
Embracing the Demands of Consumers & Society. A Perspective from the Poultry Breeding Sector Kate Barger, DVM Director of Animal Welfare at Cobb-Vantress, Inc. EPIC November 2013 Topics Evolution of Perspectives in Animal


slide-1
SLIDE 1

“Embracing the Demands of Consumers & Society…. A Perspective from the Poultry Breeding Sector”

Kate Barger, DVM Director of Animal Welfare at Cobb-Vantress, Inc. EPIC – November 2013

slide-2
SLIDE 2

Topics

  • Evolution of Perspectives in Animal Agriculture

– Poultry industry & primary breeders – Customers & society

  • Challenges in the future for poultry production

– Sustainability – Balancing values, costs, and demands – Innovation and technology possibilities

slide-3
SLIDE 3

Evolution of Agriculture

  • Historically: farmers set the ‘rules’

– Welfare: Take good care of animals = good production – Most have personal knowledge & connection

  • Transformed agriculture: companies set ‘rules’

– More animals/farm(er), increased technology available – Larger public body with less knowledge/connection

slide-4
SLIDE 4

Industry: Evolution in Animal Ag

  • Lower mortality
  • Less culls
  • Less injuries (skin/bone)
  • Better health & welfare
  • Better production and

better efficiency

– More meat (yield) – More eggs & chicks – Better use of natural resources & energy

 Primary Breeder  Poultry Industry  Company  Farmers

slide-5
SLIDE 5

Industry: Evolution in Animal Ag

US Broiler Livability and Live Weight Trends 2001-2012

4.60 4.80 5.00 5.20 5.40 5.60 5.80 6.00 6.20 6.40 94.40% 94.60% 94.80% 95.00% 95.20% 95.40% 95.60% 95.80% 96.00% 96.20% 96.40% 2001 2002 2003 2004 2005 2006 2007 2008 2009 2010 2011 1/2 '12 Livability Live Wt. (Lbs.)

slide-6
SLIDE 6

Industry: Evolution in Animal Ag

US Broiler Feed Conversion & Live Weight Trends 1988-2012

1.85 1.90 1.95 2.00 2.05 2.10 4.00 4.50 5.00 5.50 6.00 6.50 1988 1989 1990 1991 1992 1993 1994 1995 1996 1997 1998 1999 2000 2001 2002 2003 2004 2005 2006 2007 2008 2009 2010 2011 1/2 12 Average Bird Weight Actual Feed Conversion Ratio

slide-7
SLIDE 7

1° Breeder: Evolution in Animal Ag

  • Better livability
  • Better health & welfare

– Cardiovascular – Skeletal integrity, gait – Skin, feathers, gut health

  • Better production and

better efficiency

– Eggs per HH – Hatchability, fertility – Feed conversion, meat

slide-8
SLIDE 8

1° Breeder: Evolution in Animal Ag

1957 vs. 2012 Broiler (6wks)

slide-9
SLIDE 9

Customer: Evolution in Animal Ag

  • Safe, affordable protein
  • Nutritious food
  • Choice options

– Fresh, frozen, RTE – BLSL, whole, parts – Kid & family appropriate

  • Cultural options

– Live or min. processed – Color & presentation – Variety available

slide-10
SLIDE 10

Customer: Evolution in Animal Ag

  • Certification for market

– Origin – Production system – Care & nutrition

  • Labeling of product

– No added hormones – All natural – Humane – Cage-free – Veggie diet

slide-11
SLIDE 11

Societal Perspectives about Agriculture

Top 3 Areas for Consumers Safe Food Affordable Nutritious Environment: #4 and #6 AW: #5, but is ahead of productivity & profitability

  • f farmer
slide-12
SLIDE 12

Attitudes about Animal Agriculture

If consumers lose TRUST:

  • Change buying habits
  • Brand or store
  • Product or origin
  • Stop or reduce buying
  • Social Outrage is quick
slide-13
SLIDE 13

Society: Evolution in Animal Ag

  • Questions
  • Opinions
  • Exposure
  • Experience/background
  • Influence of Social Media
  • Educational level
  • Information source

~56% do not have a ‘source’ for info ~25% list source as HSUS, PETA, Facebook **Industry, professional grps, universities are not a primary source of information

slide-14
SLIDE 14

Why the Change?

Customers/General Public

Poultry Industry Govt/Policies Advocacy Grps

slide-15
SLIDE 15

Why the Change?

  • Social expectations are changing for agriculture

& food choices due to ethical/cultural views, political pressure, public opinion, science and economics

– The Disney Factor – Human Animal Bond

  • Disconnects:
slide-16
SLIDE 16

Future of Agriculture

  • Future agriculture: challenge with rules & expectations

– Direct involvement from govt, companies, NGOs – Efficient large farms with effective use of resources – Huge public body with limited knowledge, but demand for safe, affordable and natural food supply

  • Future agriculture: challenge with supply & demand

– 50% increase in global population – 70% increase in demand for food production – 1 of 7 are malnourished currently (hunger/malnutrition = #1 risk)

2000: 6.1Billion 2050: 9.2Billion

slide-17
SLIDE 17

Future of Agriculture

(ex: different models for broiler farms)

Consumers Government

Conclusions?

  • % of mortality & culling?
  • Growth rate?
  • Expresses natural behavior?
  • Sustainable (efficient)?
  • Better welfare results?
  • Cost vs. values?

Industry

NGOs

slide-18
SLIDE 18

Future of Agriculture ??

slide-19
SLIDE 19

Challenges in the Future

Sustainability Innovation & Technology Cost vs. Values

slide-20
SLIDE 20

Challenge: Sustainability in the Future

  • Sustainability concerns

– Competition for space – Competition for raw ingredients – Competition for efficiency

  • Challenges

– Natural resources (water) – Production (farm) type – Employment vs. technology

slide-21
SLIDE 21

Challenge: Sustainability in the Future

slide-22
SLIDE 22

Challenge: Sustainability in the Future

slide-23
SLIDE 23

Challenge: Sustainability in the Future

slide-24
SLIDE 24

Cost vs. Value of Food Produced Sustainably

Growing Program/ Breed Type

Standard Standard Enriched Standard Free Range Semi Slow Semi Slow Enriched Slow Enriched Slow Free Range Slow Organic

Environment

Indoor Indoor Enriched Free Range 1m2/bird Indoor Indoor Enriched Indoor Enriched Free Range 1m2/bird Free Range 4m2/bird

Indoor Stocking Density (kg/m2)a

38 30 27.5 38 30 30 27.5 21

Indoor Stocking Density (Birds/m2)

17.3 13.6 12.5 17.3 13.6 13.6 12.5 9.5 Breeder Performance

Broiler Chicks Produced/ Breeder (60 w)

135 135 135 160 160 170 170 170 Broiler Performance to 2,200g

Average Daily Gain (g/d)

59.5 59.5 52.4 50.0 50.0 45.0 39.3 31.4

Feed Conversion Ratio (g /g)

1.68 1.68 1.80 1.85 1.85 1.95 2.05 2.65

Mortality (%)

3.25 3.00 3.25 2.40 2.35 2.30 2.45 2.85

Carcass Yield (%)

73.5 73.5 73.5 69.5 69.5 68.0 68.0 66.0

Costs

Cost/kg Live (€ / kg) w/o depreciation

0.771 0.806 0.860 0.821 0.859 0.890 0.943 1.241

Cost/kg Processed (€/ kg) w/o depreciation

1.358 1.420 1.503 1.509 1.578 1.659 1.697 2.146 % Cost Increase vs. Standard

  • 4.6%

10.7% 11.2% 16.2% 22.2% 25.0% 67.3% UK Consumption Capacity

Consumption of Chicken per Capita per Year @ a fixed farming base (kg)***

22.2 17.0 13.7 18.3 14.4 12.9 10.4 6.3

Consumers largely purchase on price. Selling significant volume > 10% above standard cost is difficult

Intensive……………………………………………………………..Extensive

slide-25
SLIDE 25

Challenge: VALUES vs. COST

VALUES:  Safe origin  Ethical system  Variety of choices  Wholesome (nutritious) COST:  Affordable  Value for money

slide-26
SLIDE 26

Challenge: VALUES vs. COST

One of the most powerful demands currently: Right to know what is in their food (don’t want to be denied knowledge, especially when what they eat is emotive)

slide-27
SLIDE 27

Challenge: VALUES

 Safe

  • Residues? Hygiene status? Antibiotic usage? Preservatives?
  • Production (farm and slaughter) methods

 Ethically raised/produced

  • Welfare standards? Audited? Health and care standards?
  • Production (farm/transport/slaughter) system

 Variety of choices

  • Production method: organic vs. non-organic
  • Farming/housing: standard vs. free-range vs. outdoor access
  • Slaughter method: standard vs. halal vs. kosher vs. fresh-market

 Wholesome (nutritious)

  • Lean meat? Nutritional levels (sodium, fat, etc.)
  • Nutritious for variety of health needs
slide-28
SLIDE 28

Challenge: COST (Supplier)

 Affordable

  • Breed investment: smart use of research & internal efforts
  • Breed distribution: cost to deliver egg/chick and service
  • Direct and indirect distribution
  • Breed cost per unit: to produce and to sell
  • Volume of product sold

 Value for Money

  • Breed performance: return on value for breed purchased
  • “Easy” to raise, hatch, generate next level
  • Flexibility and robustness of breed under varied conditions
  • Variety of final product for sale: broiler age/weight, eggs, etc.
slide-29
SLIDE 29

Challenge: COST (Customers)

 Affordable

  • Producer: cost for egg/chick/broiler/meat produced
  • Retailer: cost for meat purchased vs. retail price
  • Consumer: cost for meat purchased

 Value for Money

  • Ability to feed family with product
  • Religion, economics, kitchen resources, health restrictions
  • Easy to produce, to transport, to prepare, to cook, to eat
  • Flexibility in what and how product is sold
slide-30
SLIDE 30

Challenge: Innovation & Technology

  • Biotechnology: Focus on improved efficiency for the

future selection for animal agriculture

– Disease resistance – Animals that can cope with changing climate – Efficiency with available resources – Reduce environmental impact – Improve effectiveness and accuracy of selection of animals for specific traits

slide-31
SLIDE 31

AGCTAGCTGTCGATGATCGATCGATCGATGTGTCATATAGCT AGATCTAGCTAGCTAGCTAAGTCGATCGATCATATAGCGATC GATCGGGTGTATGGCTAGCTAGATGCTAGCTAGCTAGCTAG CTTATGGGGCTTTTTATCTATCGATTTTATCGGCGCGATCCTA TCGGAGCTAGGATCGATCGATCGATCGATTATCGCGCGCGC TCTCGATATATAGCTCTATCGATCGATCGAGATCTCGAGAGAT CGAGGATCGATAGGATCGATAGGCTAGATCGATAGGAGAG ATCGAGGAGAGAGCTCTCGATCGATAGCTAGATCGATAAGC TAGCTGTCGATGATCGATCGATCGATGTGTCATATAGCTAGAT CTA Increased accuracy of Breeding Values Sample collection DNA typing (large scale) DNA analyses Selection of

breeding stock

Add Collection of Genomic (DNA) Data (Genotypes)

Disease Resistance……Performance…..Food Safety…..Welfare……Meat Quality…..

slide-32
SLIDE 32

With quantitative genetics we could satisfy 70% of the required increase in meat production by 2020 (45%) if we continue with the current selection targets

Challenge: Innovation & Technology

Traits – Cobb500™ 1980 1990 2000 2010 2020 Change 2010-2020 Body Weight to 42 days (g) 1135 1588 2042 2495 2948 18.2% Feed Conversion (kg Feed/ kg weight) 2.20 2.00 1.80 1.60

  • 11.1%

Breast Meat % 21.4 26.4 31.4 18.9% Breeder Production (Chicks to 65 weeks) 111 125 133 139 4.5%

slide-33
SLIDE 33

Challenge: Innovation & Technology

  • Breed options: Focus on Primary Market, but be

prepared for emerging markets and maintain diversity in breed profile/genetics

– Testing breeds in varying challenging situations

  • Nutrition
  • Production systems
  • Environment or health options

– Cryogenics preservation – Acquisition of lines

slide-34
SLIDE 34

Challenge: Innovation & Technology

  • Chicken Care: Focus on daily care and increased

proactive response or decision making to optimize growth, performance and welfare

– Monitoring birds & people – Prediction of future outcome – Prediction of needs – Less people, but focus

  • n interests & capability
  • f the people who interact

with the birds

slide-35
SLIDE 35

Challenge: Innovation & Technology

  • Procedures & Methodology: Focus on

improvements in how we operate, especially for areas that may be questioned by society

– Transportation – Euthanasia – Slaughter – Antibiotic use – Health status (zoonotic)

slide-36
SLIDE 36

Closing Thoughts

  • We will always have opportunities to evaluate and to

improve our current practices.

– FUTURE: We can make a positive difference before we are forced to do so.

  • We have an opportunity and an expectation to help

feed the growing global population.

– FUTURE: We need to consider sustainability, the cost vs. values paradigm and the use of technology to be successful with this on-going challenge.

  • The customer and the global society will continue to be

complex and to demand the ‘right to know.’

– FUTURE: what we do and how we communicate this can have a real impact

  • n trust between agriculture and society and how we will (or can) do

business in the future.

slide-37
SLIDE 37

We all represent agriculture & food production everyday! Thank you!