
Poster Child for Healthy Growth Simple, low-cost growth charts can reduce stunting. Carlos Acero Primary Investigators: Günther Fink, Rachel Levenson, Peter Country Director, IPA Zambia cacero@poverty-action.org Rockers, and Sarah Tembo
Summary In-home growth charts reduced stunting among previously • malnourished children by 22 percentage points. Community-based growth monitoring, in contrast, did not • produce significant improvements. Neither program was found to impact cognitive development. • Growth charts appear to be a cost-effective tool for reducing • stunting.
Child stunting is pervasive Chronic malnutrition has adverse long-term effects on cognitive, physical • and mental development Stunting is pervasive • Up to 45% of children in Zambia • Progress limited , particularly in rural areas • 2011 National Food and Nutrition Strategic Plan • What could limit progress? • Lack of parental knowledge about stunting • Lack of tools for parents to assess child’s growth • Lack of household resources •
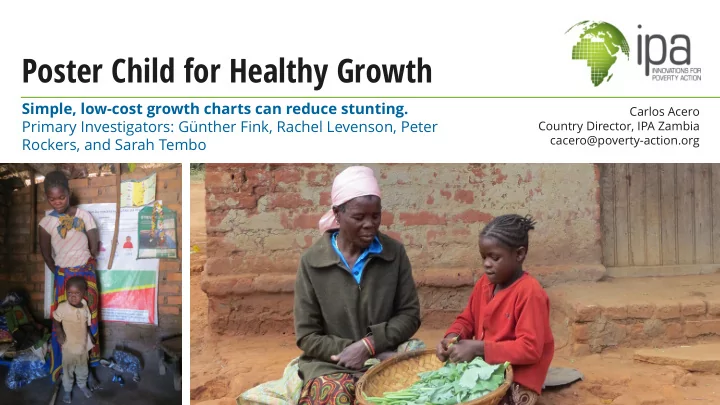
Growth Charts Easy-to-use growth chart • installed in homes Locally developed and • tested a few versions Separate poster for boys • and for girls 4
Community Meetings Three rounds of meetings Study team implemented four activities at meetings: 1. Community sensitization on malnutrition 2. Measurement of height, weight, and MUAC 3. Distribution of protein (Yummy Soy) supplements to stunted children younger than 30 months old 4. Refer children with acute malnutrition to health center 5
Study Design IPA worked with researchers to test these two interventions. Different methods of disseminating knowledge • Different tools for assessing growth • Sample – 547 Children, 6-24 months old P=1/3 P=1/3 P=1/3 Control Group Community Meetings Posters
Evaluation Details 127 rural, subsistence farming communities in Chipata District • 2014-2015 • To assess impact on stunting : measured impacts on children’s • height-for-age and overall development To assess impact on parental behavior : administered a detailed • food questionnaire for parents about child’s consumption
Results Impacts on Stunting In-home growth charts improved growth among malnourished children, reducing stunting by 22 percentage points . Community-based growth monitoring with nutritional supplements, on the other hand, did not have significant impacts .
Results Impacts on Child Development and Parent Behavior Neither program was found to impact children’s cognitive • development. These benefits may still occur over a longer timeframe than the study covered. • Caregivers in both groups reported feeding their children more • protein-rich foods than caregivers in the comparison group. The growth charts program achieved larger impacts on all observed behaviors. • Parental aspirations may have played a role. •
A Cost-Effective Program Growth charts appear to be a cost- effective tool for reducing stunting. For every dollar that was invested in growth charts, children who otherwise would have been stunted gained an estimated $22 in additional lifetime wages. Return on investment calculated from Fink, G., Peet, E., Danaei, G., Andrews, K., Charles McCoy, D., Sudfeld, C. R., Smith, M., Ezzati, M., Fawzi, W. W. 2016. “Schooling and wage income losses due to early-childhood growth faltering in developing countries national, regional, and global estimates." American Journal of Clinical Nutrition , 104 no. 1 (July): 104-12.
Policy Lessons Growth charts installed in homes appear to be a • cost-effective tool to reduce stunting in Zambia, Satilani kakulidwe ka mwana kuti afike pa muyeso wake 155 and should be evaluated at scale . 150 Kumbukani: • Nthawi zonse muyenera kusewenzesa ufa wa mgaiwa kudyesa mwana wanu 145 • Mwana wa thanzi ayenera kudya kanai kufikira kasanu (4-5) pa tsiku 140 • Ana a thanzi ndi mphavu ayenera zolimbitsa thupi, zomwe Sebenzesani zakudya zosiyana-siyana zomwe apezamo muzakudya monga nsomba, nyama,mazira kapena zipezeka kuno kwanu monga ndiwo za 135 soya beans masamba, kapenta, kayela, shawa, kachamba, chinangwa, mapila, mpunga, mkaka wa fresh kapena mawisi, zipaso ndi mafuta ophikila. 130 125 2 year 2 years 6 months 120 3 months Further studies are needed to determine 1 year 2 years __________ • 1 year 9 months _________ 115 1 year 6 months _________ 3 months _________ _________ 110 1 year _________ whether this intervention would work elsewhere. 9 months _________ 105 _________ 100 95 90 85 80 More research is needed on longer run impacts . 75 • 70 65 Ngati mwana wanu ali mugawo lofiira, chonde 60 pitani naye ku chipatala chili pafupi ndi inu To what extent do impacts last during lean season? • kapena munga tume lamya ku IPA Zambia pa 55 nambala iyi 0976703901.
Thank you This project was funded by the Bill & Melinda Gates Foundation. poverty-action.org
Recommend
More recommend