
SLIDE 1
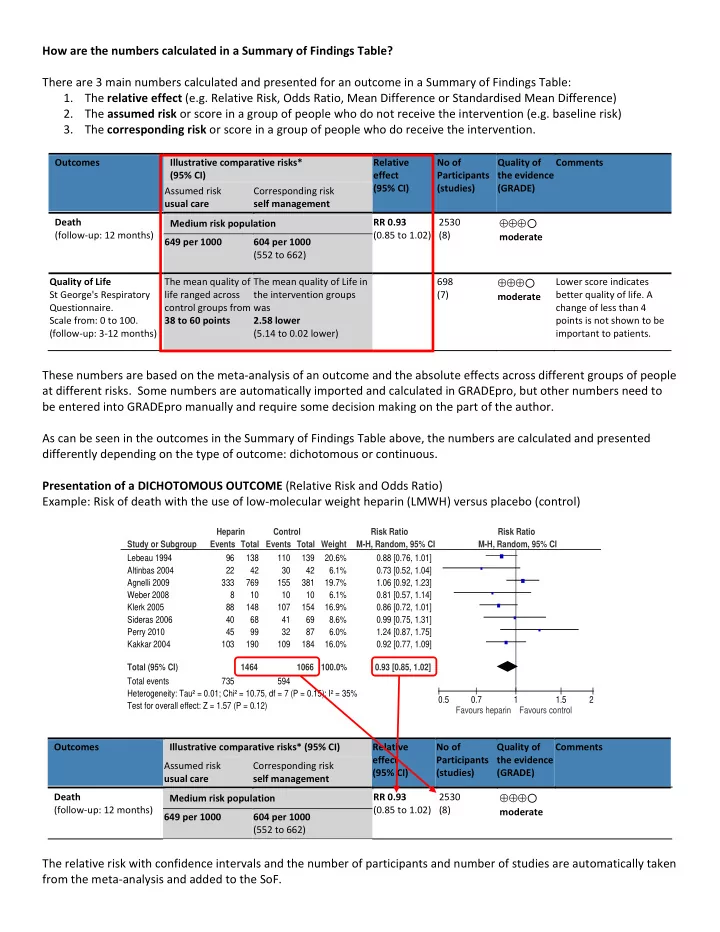
How are the numbers calculated in a Summary of Findings Table? There are 3 main numbers calculated and presented for an outcome in a Summary of Findings Table:
- 1. The relative effect (e.g. Relative Risk, Odds Ratio, Mean Difference or Standardised Mean Difference)
- 2. The assumed risk or score in a group of people who do not receive the intervention (e.g. baseline risk)
- 3. The corresponding risk or score in a group of people who do receive the intervention.