Positioning and controlling 2. The problem 3. Aims Walkability - - PDF document

positioning and controlling
SMART_READER_LITE
LIVE PREVIEW

Positioning and controlling 2. The problem 3. Aims Walkability - - PDF document

Outline 1. Background Positioning and controlling 2. The problem 3. Aims Walkability policy making 4. Theoretical framework 5. Walking and Sojourning in public space (W+S) 1. Status Quo Walking, Sojourning and Walkability 2. System


slide-1
SLIDE 1

Positioning and controlling Walkability policy making

Rob Methorst

26-10-2017 1

Outline

1. Background 2. The problem 3. Aims 4. Theoretical framework 5. Walking and Sojourning in public space (W+S)

1. Status Quo Walking, Sojourning and Walkability 2. System outcomes 3. System Impacts 4. Points of special interest

6. Policy input towards W+S system

1. Status Quo Institutional Framework (system input) 2. System outcomes 3. System impacts 4. Points of special interest

7. Keys to change

26-10-2017 2

  • 1. Background
  • The importance of walking and sojourning in public space

(W+S)

  • The walkability domain is badly covered in research, data
  • Most (academic) research incl. COST 358: content oriented
  • However:

Problems and countermeasures are more or less (academically) known. Not much is being done (institutional process) …

  • Public space: owned by government

Policy responsibility and accountability for all activities in public space

  • Focus of academics and policymaker differ (Bax)
  • ICTCT:

International Co-operation on Theories and Concepts in Traffic Safety

26-10-2017 3

  • 2. The problem
  • Walking and sojourning largely outside the vital citizen’s image
  • ‘Captives’ (children, elderly, handicapped) experience:
  • Limitation of freedom to move about
  • Inconveniences (obstacles, waiting, discomfort, ugliness and filth, dog shit,…)
  • Danger (specially falls, crossing accidents)
  • The importance of walking and sojourning (W+S) is severely underestimated

in statistics, information, knowledge, media and in policy

  • W+S does not fit the usual compartments
  • Willfully grown policies, concepts and images obstruct vision
  • Definitions, disciplines: W+S on #3, no problem owner
  • No local figures
  • Some revealing national data on mobility, sojourning, wandering, un-safety
  • Social trends pressurise conditions
  • Up-scaling, ageing of society, ICT, autonomous cars, living demands & urbanism, decentralisation

and deregulation, participation, health care systems

  • Increasing number of vulnerable people
  • Often decreasing reachability and accessibility.

26-10-2017 4

  • 2. Aims
  • A. Deliver consistent framework of theories

What questions need to be asked for the support of walkability assessment and policy development?

  • B. Determine Status Quo of walking and walkability

Insight in walking, sojourning and walkability in public space and current policy making: case The Netherlands

  • C. Lay down promising solutions

View on kinds of effective and fair measures supporting better conditions for walking and sojourning.

26-10-2017 5

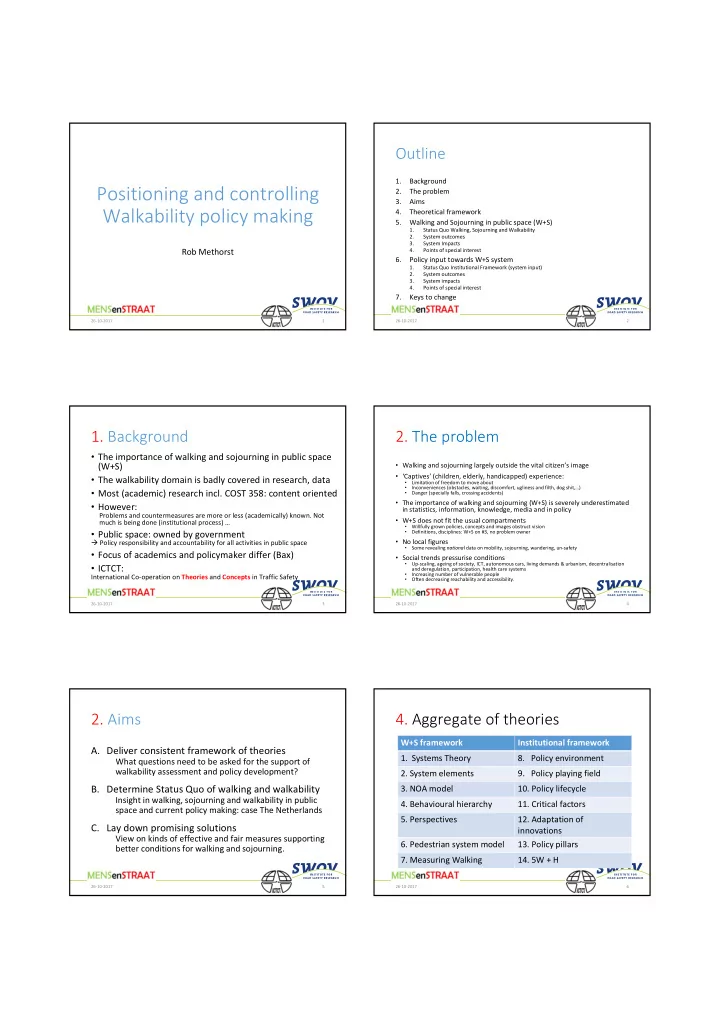
  • 4. Aggregate of theories

26-10-2017 6

W+S framework Institutional framework

  • 1. Systems Theory
  • 8. Policy environment
  • 2. System elements
  • 9. Policy playing field
  • 3. NOA model
  • 10. Policy lifecycle
  • 4. Behavioural hierarchy
  • 11. Critical factors
  • 5. Perspectives
  • 12. Adaptation of

innovations

  • 6. Pedestrian system model
  • 13. Policy pillars
  • 7. Measuring Walking
  • 14. 5W + H
slide-2
SLIDE 2

4.1. Systems Theory

26-10-2017 7

(Heylighten, 1992) Environment

  • utput

System

(i.e. Pedestrian travel & sojourn system) (Physical, Social, Transportation, Economical, Political, ...)

Environment input

  • utcome

impact feedback

Throughput See slide 3.2. See slide 3.8 – 3.13

4.2. System elements

26-10-2017 8

(Methorst, 2010, 2017)

E N V I R O N M E N

T

E N V I R O N M E N

T

Pedestrian Trans- portation Social environ- ment Physical environ- ment

input

  • utput
  • utcome

ICT/ITS

See next slides 3.3 – 3.7

4.3. NOA

26-10-2017 9

societal developments Needs (N) Opportunities (O) Abilities (A) OS MP BC Abilities (A) Behaviour

OS = Opportunity Search MP = Motivation to Perform BC = Behavioural Control (Steg & Vlek, 2009)

3.4. Behavioural Hierarchy

26-10-2017 10

Levels of behaviour Type of decisions Behavioural goal Lifestyle Fundamental decisions. Relates to goals for life and skills for living. ‘Being’ and identity Strategic Decisions relating to travel or purpose (motive), where to go (destination) and which mode will be used. ‘Going’. Tactical Decisions with regard to the route to be taken, places to cross, walking or driving speed and so on. ‘Traveling’. Operational Operational decisions or reactions concerning other road users, the traffic situation and other interacting persons and

  • bstacles.

‘Walking’ and 'Sojourning'

(Michon, 1979; Hatakka et al., 1999)

4.5. Perspectives model

26-10-2017 11

Perspectives Question Who’s perspective?

Functional

What is being offered to meet the needs and abilities of pedestrians? Expert’s perspective focusing on supply side

Perception

Wat is being requested to meet the pedestrian’s subjective quality needs? Pedestrian’s perspective focusing on the demand side

Durability & Future prospects

How can decisions be balanced to take future interests into account? Expert’s opinions on facilitating and sustaining pedestrian activity

(RARO, 1990; Methorst et al., 2010)

4.6. Pedestrian System

26-10-2017 12

Tactical behaviour

Travelling

Behavioural pre- cursors, Basic risk factors Operational behaviour

Walking

Behaviour, Performance, Coping, Disturbances in freedom of action Strategic behaviour

Going

Manifest needs, Options for mobility Individual options for mobility:

Needs perceived Opportunities Abilities

Social context

(Collective needs, rules, norms, communication etc.) Physical Environment & Land Use characteristics

Transport system W+S needs, Task abilities & Perceived Opportunities Characteristics of nearby people and traffic Route characteristics Accessibility & usability of transport modes W+S needs, Task abilities & Perceived Opportunities Interference / communication with nearby people and traffic Site characteristics Accessibility & usability of transport modes Individual travel motives Lifestyle behaviour

Being

Human needs, Goals of life, Skills of life

Arriving

and/or

Sojourning

Determinants Lifestyle/Strategic level Determinants Tactical level Determinants Operational level

Experiences Perceived walkability

Tales

W+S needs, Task abilities & Perceived Opportunities Interference / communication with nearby people and traffic Site characteristics Accessibility & usability of transport modes Determinants Operational level

(Methorst, 2010, 2017)

slide-3
SLIDE 3

26-10-2017 13

4.7. Measuring Walking

Monitoring / Evaluation

Institutional framework (Institutional) products & activities Performance, behaviour & perceptions Bottom-line effects (benefits) Transport units, Modal integration Tools (ambulant hardware) Infrastructure & public realm: features, Qualities (static hardware) Leadership Knowledge & professional skills Resources Strategies & Policies Co-operation & Partnerships Information, promotion & education / Enforcement (social context) Road user activity, modal share, traffic volumes & activity in public realm Accidents (collisions &falls) & threats (security) Atmosphere & experience of space, sociability & culture of human interaction Perceptions, satisfaction, motivations, attitudes & wishes Transportation effects Social effects Ecological effects Economic effects Health effects

INPUT OUTPUT OUTCOME IMPACT

(Sauter & Tight, 2010)

4.8. Policy Environment

26-10-2017 14

Policy making

International preconditions Transportation conditions Physical conditions Economic conditions Social and cultural conditions Scientific & Technological conditions Political conditions (Methorst, 2017)

Information & Communication Technology

4.9. Policy playing field

26-10-2017 15

Strategists

(politicians / deciders, policy makers, policy entrepreneurs)

Clients

(citizens: pedestrians,

  • ther public space users,

affected persons)

W+S Facilitators

(planners, providers, construction, Management & Control)

Catalysts

(dedicated, respected outsiders) Key: two way influence main target secondary target

4.10. Policy Lifecycle

26-10-2017 16

Political concern rating time

Discovery phase Political phase Implemen- tation phase Management & Control phase (Winsemius, 1986)

4.11. Critical Factors

26-10-2017 17 Management & Control phase Discovery phase Political phase Implemen- tation phase

  • I. Awareness

II.Commitment

  • III. Competence
  • IV. Performance

Key: Cycle direction

(generally)

(Methorst, 2010)

3.12. Adaption of innovations

26-10-2017 18 Experts Suggested Innovation Perceptions

  • f Problems

(Crises) Industry Interests Technical requirements Social Feasibility Adoption of Innovations Technical feasibility Non-business Interest Groups Political Feasibility Experience Perceived Effectiveness Perceived distribution

  • f Benefits

and Costs Sanctioned Discourse Decision making procedures Active agents Requisites for adoption Factors

(Feitelson & Salomon, 2004)

slide-4
SLIDE 4

4.13. Policy Pillars

26-10-2017 19

Leadership Knowledge & Professional skills Strategies & Policies Resources Co-operation & Partnerships Institutional framework (Sauter & Tight, 2010; Methorst, 2017)

4.14. W’s + H

Topical questions-principle (Spencer-Thomas, 2012):

  • What happened?
  • Who is it about?
  • Why did it happen
  • When did it happen?
  • Where did it take place?
  • How did it happen?

26-10-2017 20

  • 5. Content re. W+S
  • 1. System Status Quo
  • 2. System outcomes
  • 3. System Impacts
  • 4. Points of special interest

26-10-2017 21

5.1. System Status Quo

  • Pedestrians

Being: roles, needs, abilities, groups, numbers

  • Social environment

People in environment, rules, norms & values

  • Physical environment

Site – network – Land Use

  • Connected transportation

Units, kinds, mobility needs

  • Information and Communication Technology

Operational, tactical, strategic information

26-10-2017 22

5.2. System Outcomes

  • Pedestrian behaviour

(def.: movement [main mode, sub mode, circulation] and sojourning behaviour)

  • Accessibility

(def.: access on foot of sought after locations of activities)

  • Safety

(def.: concerns all injuries, i.e. traffic crashes + falls)

  • Perception / Satisfaction

(def.: user opinions re. the quality of walking and sojourning)

What, who, why, how, where, when?

26-10-2017 23

5.2.1. Pedestrian behaviour

General types of activities:

  • Door-to-door walking (main mode mobility = ‘journey’)
  • Walking to and from other modes (sub-mode mobility = ‘trip’)
  • Circulation (shopping, walking the dog, wandering,…)
  • Sojourning (playing, enjoying the sun, protesting, …)

Aspects:

  • Volumes, Modal share
  • Travel and sojourning motives
  • Action radius, Travel distances
  • Time spent in traffic and public space
  • Walking speeds
  • Use of walking aids
  • Single or group-walking
  • Co-existence: external influences, interference, reactions
  • Multi-tasking: distraction, mobile phone use, carrying goods
  • Walking under influence
  • Crossing the street - Jay-walking

26-10-2017 24

slide-5
SLIDE 5

4.2.1a. Main mode mobility

26-10-2017 25

NL statistics

5.2.1b. Travel time on foot

26-10-2017 26 0,0 2,0 4,0 6,0 8,0 10,0 12,0 14,0 16,0 18,0 20,0 total travel time on foot 12+ door-to-door walking 12+ Minutes pppd

NL statistics Calculated from main- mode data

5.2.1c. Circulation, Sojourning

Circulation

  • 63% of the Dutch (10,5 million persons) walk for recreation
  • 26 journeys > 1 hour+ walks pppy = 49 hours pppy (per person per year -

total population)

  • Walking is most popular recreational activity (26 journeys pppy),

followed by shopping in city centre (12 journeys pppy)

  • Walking the dog: 47 journeys pppy = 12 hours pppy

Circulation = > 60 hours pppy Sojourning

  • No data available estimated: > 50 hours pppy

(8 min pppd)

26-10-2017 27

Wandelnet ,2016; CBS

5.2.1.d Total time in public space

26-10-2017 28

Activity

Time pppy (indicative) Percentage time in public space Door-to-door walking 43 hours 8% Walking to/from other modes 66 hours 12% Circulation 60 hours 11% Sojourning 50 hours 9% As pedestrian 220 hours 41% Other modes 315 hours 59% Total 535 hours 100%

5.2.2. Accessibility

Access on foot of sought after locations of activities:

  • Sidewalks and footpaths
  • The other side of the street/road
  • Buildings
  • Areas
  • Essential services
  • Transfer points to other modes (buss, tram and

metro stops, train stations, Car parks, …)

  • No data ….

26-10-2017 29

5.2.3. Safety real numbers pedestrian casualties

26-10-2017 30

Fatalities Hospitalised casualties ER admittances Total number of casuaties

2003- 2007 2010- 2014 2003- 2007 2010- 2014 2003- 2007 2010- 2014 2003- 2007 2010- 2014

Pedestrians 150 142 5.200 8.700 49.700 51.200 55.000 60.000

  • Falls

45 78 3.900 7.100 45.900 48.300 50.000 55.500

  • Collisions

74 64 1.300 1.600 3.800 2.800 5.000 4.500 Bicyclists 220 186 7.600 13.700 60.200 72.300 68.000 86.200 Car users 386 218 3.900 3.800 26.000 24.000 30.300 28.000 Other modes 207 150 4.300 4.900 22.500 21.000 27.000 26.000 Total 963 696 21.000 31.100 158.400 168.400 180.000 200.200 Source:

CBS LMR LMR LMR LIS - LMR LIS – LMR LIS - corr LIS - corr

slide-6
SLIDE 6

5.2.4. Perception / satisfaction

Role

  • Perception conditions walking and sojourning decisions

Key characteristics

  • The fate of common things is oblivion: ‘not a problem’.
  • People only consciously experience walking when they or their loved
  • nes have (severe) trouble coping with walking tasks and risks: children,

the elderly, people with limited mobility.

  • Policy makers and researchers seldom belong to vulnerable groups
  • Positive walkability experiences may motivate to go to such nice sites or

even relocate.

Results

  • Sources: tales, complaints, satisfaction surveys
  • Problems: dangers from traffic, security issues, street crossing, route

avoidance, suppressed mobility and presence in public space

  • Assets: walkability attracts crowds, people attract people liveability,

mobility, health, profit.

26-10-2017 31

5.3. System Impacts

  • Economic: Walkonomics = social cost and benefits
  • Ecology: People Planet Profit = sustainability
  • Social conditions, incl. Social Justice
  • Mobility vs transportation poverty
  • Health: as precondition and as consequence

26-10-2017 32

4.4. Points of special interest

  • Walking and sojourning in public space are not measured:

if not counted it does not count

  • Definitions of ‘mobility’ and ‘casualties’ are dysfunctional:

the largest features and problems are hidden

  • Inequality aspects and impacts:
  • Travel poverty
  • Vulnerable groups: children, elderly, people with limited mobility
  • Pedestrian second rate road user (long waits, extra risks, facilities)
  • Safety issues: #1 Falls #2 pedestrian crossings
  • Reachability and access of essential functions, incl. PT
  • Maintenance of facilities

26-10-2017 33

5.5. Basis solutions for pedestrians and cyclists

  • 6 C’s network requirements:

Connected, Convenient, Convivial, Conspicuous, Comfortable, Co- existence

  • Speed > 30 km/h, then:

Separate pedestrians & cyclists from motor traffic: side walks, cycle paths

  • 5 Crossing facilities requirements:

Facilities if real potential conflict, Convenient location, 2 side conspicuousness, Traffic calming (speeds <30 km/h), Short (max 2 lanes)

  • Maintenance:

Flat, anti slip, obstacle free.

  • Pedestrian competences:

Fall prevention - stability training, particularly females 55+, although…

34

  • 6. Policy input towards W+S System
  • Focus on policy input towards W+S system

Autonomous change is taken for granted

  • Key question: how is the policy system organised

26-10-2017 35

Policy Pillars: 6.1 Leadership Questions: 6.2 Knowledge & Professional skills Role and function 6.3 Strategies & Policies Key characteristics 6.4 Resources Preconditions 6.5 Co-operation & Partnerships Status Quo

6.1.1. Leadership

  • Role & function:
  • Setting goals = choices = giving direction
  • Putting policy process in motion = make improvements happen
  • Key characteristics:
  • Propensity: based on awareness, commitment; emotional load responsibility accountability
  • Power
  • Persistence
  • Preconditions:
  • Most needed in early and late stages of policy process
  • Control and success depends on maturity of W+S culture
  • Status Quo:
  • Centre of gravity is on local level
  • No clear leadership in the domain.

26-10-2017 36

slide-7
SLIDE 7

6.1.2. Knowledge & Professional Skills

  • Role and function:
  • Position, advance and underpin discussions, implementation and monitoring
  • Key characteristics:
  • Personal attribute, scarce and takes years to build
  • Needed throughout the policy process
  • Preconditions for effective measures:
  • Adequate knowledge on how system works and can be improved
  • Adequately educated, trained and skilled staff
  • Inviting, mature policy culture promoting State of the Art
  • Status quo:
  • Use of sources depend on time available and level of knowledge and prof. Skills;

knowledge is limited

  • Experts are mostly self-educated; overview is not a strong point
  • Knowledge mostly limited to traditional definitions of mobility and safety
  • Distribution of knowledge: low level at law enforcement; highest levels at front end

municipalities, NGO’s, CROW, KC Sports, ministry of Health, Well-fare & Sports

26-10-2017 37

6.1.3. Strategies & Policies

  • Role and function:
  • ‘manual’ and reference for policy implementation
  • Key characteristics
  • Relate to policy culture and maturity
  • Streamlines policy process (cascade of actions; Fundamentals cannot be solved on
  • perational level; need to be solved ‘upstream’)
  • Great variety in policies and strategies
  • Preconditions
  • Justified
  • SMART formulation
  • Coherent and consistent
  • Embedded in legal framework and organisational structures
  • Flexible enough to enable coping with unexpected developments and policy

consequences

  • Status Quo:
  • Distribution of policy activities: front-end municipalities most active; systems

approach not yet feasible; in designing cities the pedestrian never was out of the picture.

26-10-2017 38

6.1.4. Resources

  • Role and function:
  • Help provide building blocks for the creation of opportunities
  • Key characteristics:
  • 3 kinds: hardware, software, orgware
  • Need depends on characteristics of strategy
  • Preconditions:
  • Powerful preconditions can be shaped on national level
  • Availability of resources within umbrella projects
  • Status Quo:
  • Difficult to identify how much budget and other resources are spent; this weakens

argument for action

  • Money does not seem to be the main issue; Knowledge & Prof. skills and staff more

important

  • Input of manpower: front-end municipalities ~0.5 fte; dedicated NGO’s 1.5 – 5 fte

26-10-2017 39

6.1.5. Co-operation & Partnerships

  • Role and function:
  • Combining individual spans of control and competences
  • Key characteristics:
  • One or more shared reasons
  • Policy actors do not have full control over the matter
  • Policy actors expect to achieve aims at tolerable effort
  • Preconditions:
  • Trust, confidence, senior management support, ability to meet expectations, clear

goals, partner compatibility and conflict management

  • Status Quo:
  • Inter-agent co-operation and partners not feasible because of little working time

available

  • Some alliances between NGO’s, knowledge institutes and consultants

26-10-2017 40

6.1.6. Institutional improvement potentials

  • Fact finding
  • International developments
  • Status Quo, developments and

impacts

  • Evaluation of policy activities
  • Competence building
  • References function
  • Learning opportunities
  • Information exchange
  • Guidance on solving problems
  • Personnel management
  • Direction and allotment
  • Vision
  • Visibility, position and priority of W+S

domain

  • Playing field management
  • Distribution of resources
  • Co-operation and partnerships

20-7-2017 41

  • Communication
  • Communication
  • Participation
  • Events
  • Operational organisation
  • Legislation and regulation
  • Reinforcement of legislation and

regulation

  • Long-term plans
  • Mid-term plans
  • Operational plans and

implementation

  • Management, maintenance and

surveillance.

  • 7. Keys to change
  • Institutional precondition determine the rate of success
  • Update definitions of mobility and traffic accidents/casualties
  • Measure walking adequately, using multiple data sources to construct an

actual image of actual problems, costs and benefits

  • Professional skills essential for analysing and solving problems
  • Basic solutions for pedestrians:

6 C’s; motor speed <30km/h; adequate crossing facilities; good maintenance; stability training

  • Integral approaches to solve problems:

Integrate Land Use, Infrastructure, Communication & Information Technology, Education, Enforcement, interdisciplinary co-operation

  • Measures only work when implemented:

Preconditions: Awareness, Commitment, Competence; only implementations does the trick.

26-10-2017 42

slide-8
SLIDE 8

Thank you for your attention!

26-10-2017 43

Contact: Rob Methorst Rob.methorst@telfort.nl Rob.methorst@swov.nl Mob.: +31 6 2368 3444