
SLIDE 1
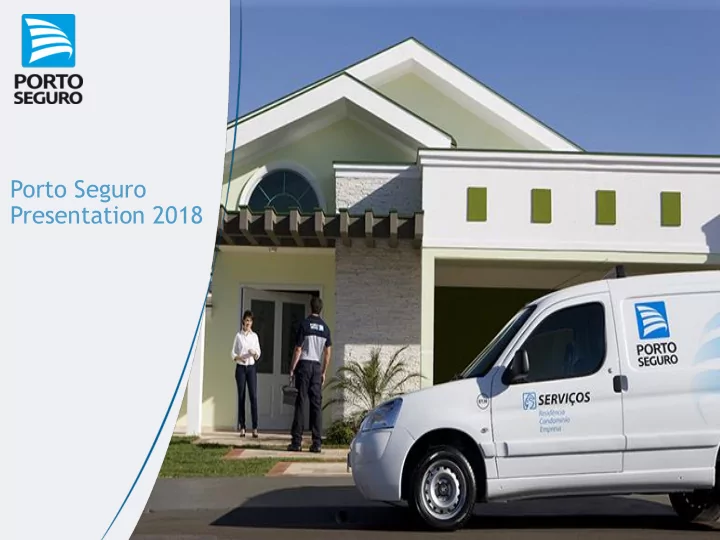
Porto Seguro Presentation 2018 Index A familys dream driven by - - PowerPoint PPT Presentation
Porto Seguro Presentation 2018 Index A familys dream driven by human relationships and a keen eye for details turning into one of the biggest companies in Brazil 1. About us 2. Differentials 3. Results and progress 4. Forward-looking 1.
4
1976- 2002 2017- 2018 2010- 2016
Launch of Azul
New Business Lines: Life and Pension, Health, Portopar (Asset), Consortium*, PortoSeg (Financing)
Partnership with Itaú
Launch of Credit Card, Health for Pet Porto Faz, Bioqualynet , Oxigênio (accelerator) and Acquisition of Auto Portfolios (Chubb and AIG) Mr Abraão Garfynkel bought Porto Seguro from Bradesco
* Pool Financing for Cars and Houses
1972 1945
Foundation
5
1st Non-life and 4th largest insurer group in Brazil 10 Million Clients and 20 Million covered items
R$17 Billion Total revenues 13K employees 35K independent brokers 16K exclusive service providers 48 Million inbound calls / year 1.7 Million home repair services / year 2.3 Million roadside assistance services / year 3,6K Itaú banking branches
(bancassurance distribution agreement)
R$19 Billion Market Cap Market leader in Auto, Homeowner and Landlord Rent Guarantee Insurance
Porto Seguro Cia de Seguros
(Auto, P&C, Financial Risks)
Portomed (HMO)
*Controlled by Jayme Garfinkel Free Float
Azul Seguros
(Auto)
PSIUPAR 70.8%
Porto Seguro Health Insurance Porto Seguro Life and Pension Porto Seguro Uruguay
(Auto, P&C, Financial Risks)
Portoseg
(Consumer Finance and Credit Card)
Portopar
(Asset Management)
Porto Seguro Consórcio (Pool
Financing Auto /House)
Porto Renova
(Recycle and Dealer Car Parts)
Porto Faz
(Convenience Services)
Porto Seguro Medical Services
(Bioqualynet, ASO)
Insurance Financial Services General Services
Porto Seguro Dental Porto Capitalization
Itaú Unibanco
43.0%
Porto Seguro Controllers*
57.0% 29.2%
Porto Seguro Surveillance
Free Float Shareholders Breakdown
(June, 2018)
24% 38% 29% 6% 3%
Brazil USA Europe Asia Other
Carro Fácil
(Long Term Car Rent)
Health for Pet
Internal Services
(Call center, sales support & Business accelerator)
6
Source: Susep / Porto Seguro
Market Share Insured Items
Written Premiums
Market Share Insured Members
Written Premiums
Market Share
Revenues Units
Market Share Insured Members
Written Premiums
Market Share
Revenues
Clients
Client’s average expenditure In number
2nd 3th
Market Share Vehicles Written Premiums
7
# of Total Revenues # of Total Revenues # of Total Revenues # of Total Revenues # of Total Revenues # of Total Revenues
8
10
11
Source: BrandZ Brasil Top 60 – Kantar & WPP (2018)
12
2018 2017 1º Beverage 8.263 8.146 1% 2º Financial Services 7.018 4.438 58% 3º Financial Services 6.198 4.359 42% 4º Beverage 4.478 4.385 2% 5º Media 4.318 4.123 5%
U$$ Million
Brand Segment Variation (%) 2018 2017 15º Insurance & Financial Services 922 640 44% 19º Energy 788 719 10% 20º Retail 768 442 74% 21º Mining 767 396 94% 25º Financial Services 634 730
Segment Variation (%)
U$$ Million
Brand
Besides the auto insurance,
services to vehicles, residences and people
Product focused on luxury cars with exclusive services and special benefits (e.g. concierge)
Exclusive services and benefits for women
Use of telematics for young people (between 18 and 24 years)
Focused on customers over 60 years of age
Auto insurance with basic coverage
Mostly offered to Itaú clients
13
14
✓ 540k insured vehicles (+17% vs. 1S17) ✓ Loss Ratio below 50% ✓ Coverage flexibility (Theft, Collision, Third Party) ✓ Payment flexibility (80% of Azul Leve clients pay in 10 instalments) ✓ Low cost products ✓ Untapped market and low product cannibalization
✓ 333 Porto – Client remembers Porto Seguro in emergency situation ✓ Anhangabaú Flood – Porto Seguro Service provider helps people and saves non-insured flooded cars ✓ Baby in car – Our call center
breaks the car window to save the baby ✓ Calling the boss – agent calls the client’s boss to explain that she would not be able to work due to a car accident
✓ Most beloved Brazilian brand in the Auto Insurance category (Consumidor Moderno Magazine) ✓ Most reliable Brazilian insurer (IBOPE + Seleções Magazine)
15
✓ Most remembered brand by costumers in the Insurance category (Top of Mind Premium) ✓ 1st place in the Satisfaction Ranking of Auto and Homeowner Insurance (Estado de São Paulo – Journal)
89 88 79 70 65 41 14 2 2 6 25 6 10 5 9 10 15 5 29 49 81
USA Italy Germany Brazil Spain France UK
Brokers+Agents Bank Channel Alternative Channel¹
managers) and nationwide brokers
training)
¹ Sales by Internet, phone, e-mail and commercial partners Source: McKinsey Research / Porto Seguro
High satisfaction rates about Porto Seguro Represent over 90% of our sales force
16
333-PORTO Campaign
Launch
Porto Seguro Credit Card (loyalty program)
insurance); Porto Oxigênio (Business Accelerator)
17
Accurate risk analysis questionnaire
Customer behavior analysis
Biggest Brazilian automotive parts purchaser
Higher recovery rates of stolen cars (500 thousand traced vehicles)
Proprietary budget and risk analysis system
Fist-rate quality service and assistance on claims inspection
Porto Seguro: 57.2%
Market (ex Porto): 66.6%
Porto Seguro: 31.9%
Market (ex Porto): 37.5%
Porto Seguro: 27.4%
Market (ex Porto): 37.7%
Porto Seguro: 79.3%
Market: 84.0%
Source: Susep/ANS
18
Porto Seguro has launched an initiative to stimulate Young Drivers to drive safely through a “Gamification” Program
19
Better recovery ratio than police force Driving Behavior Control Download app and register Drive safely and earn points Do the online course “Driving Safely” Get up to 35% discount according to your score Win a prize if you are in the top 10 ranking
Sales expansion of complementary products: Auto + Credit Card; Auto + Homeowner; Credit Card +Theft Insurance Usage of the power brand to launch innovative products and tap into new market niches: Health for Pet, Carro Fácil, Porto Faz, etc..
Business risk reduction: know-how of the insured clients base (Credit Card , Financing, Landlord Rent Guarantee insurance) Scale gains through synergetic (interconnected) products : Costs saving through the acquisition
Focus on long term relationship: High service level based on “personal touch” and differentiated loyalty programs that offer price discounts on the insurance policies Segmented Solutions (services, prices and specific groups): Auto Jovem, Auto Mulher, Itaú Roubo, Azul Leve, etc. Additional offers for Brokers: focus on advisory, new sales opportunities and additional income
Insurance
Examples
20
61% 54% 10% 14% 7% 8% 8% 7%
4% 4%
10% 12% 2013 9M18
7,7 8,6 9,1 9,4 9,6 7,4 1,2 1,6 1,8 2,0 2,2 1,8 0,9 1,1 1,3 1,3 1,4 1,1 1,0 1,1 1,2 1,2 1,3 1,0 0,5 0,5 0,6 0,7 0,8 0,6 1,3 1,5 1,7 1,7 1,6 1,6 2013 2014 2015 2016 2017 9M18
CAGR: 5%
12.7 14.4 15.5 16.2 13,5
CAGR: 12% CAGR: 7% CAGR: 14% CAGR: 6% CAGR: 16%
Auto Financial and Service Businesses P&C Life Other Insurance Health
CAGR: 8%
22
17.0
* Premiums written and revenues of financial and services businesses
CAGR 2013 > 2017
26.0% 26.3% 26.6% 27.4% 28.7% 27.6% 2012 2013 2014 2015 2016 2017 0.9% 1.0% 1.8% 1.9% 2.3% 2.5% 1.3% 1.6% 1.9% 1.9% 2.1% 2.4% 4.0% 4.1% 3.7% 3.3% 3.1% 3.2% 7.7% 8.1% 8.3% 9.7% 10.2% 10.5%
Credit Card (Revenues)
Source: Susep / Sincor / CardMonitor
Auto P&C Life Health
23
106.9% 103.9% 101.7% 93.8% 94.2% 98.6% 98.5% 96.2% 99.3% 99.0% 96.0% 96.5% 96.5% 99.1% 96.9% 92.4%
*CDI – Interbank deposit certificate, Source: CETIP
% Average CDI % Combined Ratio % Amplified Combined Ratio
90,2% 91,4% 89,0% 81,4% 83,5% 89,8% 90,0% 88,5% 90,6% 90,3% 92,1% 90,1% 89,6% 91,8% 91,7% 87,5% 23,3% 16,2% 19,0% 15,0% 11,8% 12,4% 9,9% 9,7% 11,6% 8,4% 8,1% 10,8% 13,2% 14,0% 9,9% 6,5%
24
(vs. same quarter of previous year)
64.1% 61.9% 65.2% 64.0% 61.1% 2014 2015 2016 2017 9M18
Average Loss Ratio 2014 - 2017: 63.8%
26.6% 27.4% 28.7% 27.6% 27.6% 2014 2015 2016 2017 9M18
6.1% 5.4% 7.3% 7.2% 5.6% 4.1% 1.9% 1.6%
1Q17 2Q17 3Q17 4Q17 1Q18 2Q18 3Q18
7.7% 9.2% 8.9% 10.2% 12.6% 8.8% 10.2% 9.4% 9.4% 11.6% 2014 2015 2016 2017 9M18
Source: SUSEP ¹ Ex Porto Seguro
25
¹General and Administrative Expenses (Excluding profit sharing) + Operational Expenses PS: As of 2018, adjustments were made in our financial statements as a result of the Initial Hiring Costs, which are now recorded as Deferred Acquisition Costs (DAC), following the same appropriation system of the results according to the term and risk. This regulation does not affect the Combined Ratio, representing just adjustments between accounts . However, adjustments were made in the numbers of the Press Release 2018 (pro forma) to maintain the same basis of comparison.
19,7% 19,6% 20,0% 19,3% 19,1% 16,9% 2013 2014 2015 2016 2017 9M18
26
*CDI – Interbank Deposit Certificate
¹ Futures exposures included.
(R$ Million)
(R$ Billion)
27 10,4% 12,3% 14,7% 10,8% 6,0% 108% 93% 105% 103% 129% 96% 93% 105% 109% 124% 2014 2015 2016 2017 9M18
Nominal yield (ex-pension funds) % of CDI (pension funds included) % of CDI (ex-pension funds)
27% 60% 53% 65% 44% 31% 3% 12% 7% 7% 24% 28% 25% 22% 44% 15% 7% 7% 4% 3% 2,8% 1,7% 3,4% 2,7% 2,5% 2014 2015 2016 2017 9M18 Equities Corporate Bonds Inflation-Linked Bonds (Tips) Fixed Income Floating Rate Notes 158 224 195 142 150 7 25 25 18 35 61 114 101 62 88 2014 2015 2016 2017 9M18 Insurance Others Pension Funds 226 321 363 222 273 6,6 7 7,5 8,7 9,5 2,7 3,2 3,9 4,6 4,9 2014 2015 2016 2017 9M18 Pension Funds Other Assets 9,3 11,1 10,2 13,3 14,4
578 734 896 793 974 849 711 883 1,009 923 1,108 931 16.5% 17.2% 18.6% 15.5% 15.1% 18.9% 21.4% 22.7% 24.7% 17.4% 16.2% 24.6% 133 149 113 130 135 82 2013 2014 2015 2016 2017 9M18
Total Net Earnings (R$ MM) Non-Insurance Business Net Earnings (R$ MM) Insurance Business Net Earnings (R$ MM) ROAE % ROAE % (Ex. Surplus Capital)
50.0% 60.0% 50.0% 35.0% 35.7% 40.0% 4.5% 8.8% 4.4% 3.7% 3.4% 4.6% 2012 2013 2014 2015 2016 2017 Payout Dividend Yield
2012 > 2017
(09/282018)
24%
7% 8% Recurring Net Income Total Revenues Above Minimum Requirement
(Recurring) 28%
Above Minimum Requirement ¹ Without excess of capital and considering an investment return of 100% of CDI
28
CAGR 2013 > 2017 CAGR: 12% CAGR: 0.3% CAGR: 14%
+99% +76%
+50%
2013 2014 2015 2016 2017 Sep-18 Porto Seguro Sulamérica B.B. Seguridade Itaú Bradesco
29
*From November 2004 (IPO) to September, 2018. Source: Porto Seguro
Portfolio diversification and cross-selling
Source: Porto Seguro
Acceleration in digitalization Expand in insurance industry penetration Increase operational and capital efficiency Exploring start-up companies New Auto positioning implementation model and nationwide-expansion
31
2006
2.8%
Chile
4.9%
USA
7.1%
Canada
7.2%
Spain
5.4%
Italy
8.3%
France
9.0%
UK
9.6%
Germany
6.0%
South Africa
13.8%
China
4.6%
Japan
8.6%
Australia
5.8%
30% 25% 12% 10% 10% 6%
2017
4.0% Market Premiums Growth CAGR (2007 - 2017) Pension 15% Dental 12% Homeowner 13% Life 11% Health 13% Auto 10% Total Market 12%
*Overall written premiums as % of GDP, excluding Capitalization and Health Medical Operator segments Source: Swiss RE
32
Source: Susep; Autoseg Susep; Anfavea Porto Seguro Estimatives for Insured Fleet (2017)
15.9 16.8 17.1 16.8 17.8 18.0 24.8 29.4 32.4 33.3 32.6 34.7 2012 2013 2014 2015 2016 2017e Insured Fleet (Million)* Auto Written Premiums (R$ Billion) 3.6 3.6 3.3 2.5 2.0 2.2 3.5 3.5 3.7 3.9 4.4 4.7 2012 2013 2014 2015 2016 2017e New Brand Vehicle Sales (Million) Insured Fleet Average Age* (Years) 33
Source: SUSEP / CETIP
¹Annual average Loss Ratio and CDI for each 3 years period
70% 71% 64% 65% 62% 64% 18% 19% 13% 10% 9% 12% 00-02 03-05 06-08 09-11 12-14 15-17 Loss Ratio Interest Rates
34
Source: Susep
2007 2017
14.5% 16.1% +1.6 p.p. 2007 2017
10.7% 20.3% +9.6 p.p. 2007 2017
18.7% 27.6% +8.9 p.p.
2007 2017
25.0% 34.6% +9.6 p.p. 2007 2017
3.9% 14.2% +10.3 p.p. 2007 2017
9.7% 17.3% +7.6 p.p.
35
36
Full Services (car, home, people) Basic Services (car) 100% Porto Seguro (High-End) 85%
Itaú (Bank Channel) Client´s shares of wallet 75%
Porto Azul Itaú
Intermediate Services (Car/Home) Full Services (car,home, people) Basic Services (car) Client´s shares of wallet Azul or Itaú Porto or Itaú
Azul (Lean) Porto (Complex) Lean Complex Intermediate
Anchor Price
Azul (Low End)
2 client’s choice 3 client’s choice
87% 78% 58% 62% 114% 28%
▪ Cross-selling leverage (e.g. Credit Card + Auto) ▪ Up-selling (e.g.. Auto + Homeowner) ▪ Portoserv (e.g. selling cards on behalf of the brokers) ▪ Product specialists support for brokers (e.g. Life Product) ▪ Internet sales (especially for low average price segments – e.g. travel insurance and homeowner)
¹ Loss Ratio + Commission ² Poll Financing for Auto and Houses
37 Expenses¹ Growth
7% 5% 12% 14% 11% 15%
ROAE
Self-handling Services
+ 1 Million of users downloaded our APPs (Auto, Health, Credit Card and Consortium)
Chatbot
Innovation on Customer Services (e.g. searching for hospitals network, claims status and payments follow- up) Broker’s program that works especially on sales arising from the internet, focusing
OnCorretor
Broker's digital inclusion program to professionalize the sales actions through the internet
Multichannel
38
(In the pipeline)
60.0% 50.0% 35.0% 35.7% 40.0% 8.8% 4.4% 3.7% 3.4% 4.6% 2013 2014 2015 2016 2017 Payout¹ Dividend Yield²
¹ Total Dividends Paid (Dividends + Net Interests on Capital) divided by Adjusted Net Income ² Dividend yield in relation to Stock Price (Total Dividends paid Divided by Stock Price on the last day in the period)
39
Source: Porto Seguro
Revenues Active Contracts
Revenues PETs
Revenues Services provided in 2017
communication and positioning
40
▪ Develop a sophisticated digital delivery platform ▪ Innovate the process
buying services ▪ Scale-up by cross-selling
❑ Under-penetration pave the way for a consistent and long-term growth ❑ Many business lines enable us to innovate, differentiate and excel (eg. Financial Services , Auto, etc..) ❑ Fluctuation in interest rates can be offset by improvements in operational results – long track-record of successful execution ❑ Valuable brand, solid relationships and emphasis on customer-oriented services lead to superior profitability ❑ The brokers/agents and new niches increase penetration, specially in non-mandatory insurance markets – new distribution channels are complementary ❑ Digitalization provides unique customer experiences in the future – senior management priority ❑ There are operational efficiency gains to conquer in regards to process improvement, non-mature businesses and right-sizing the capital base
41
Investor Relations Department
Alameda Barão de Piracicaba, 618 11th floor Campos Elíseos 01216-010 São Paulo, SP, Brazil Phone: (55 11) 2393-7092 (55 11) 2393-7093 E-mail: gri@portoseguro.com.br www.portoseguro.com.br