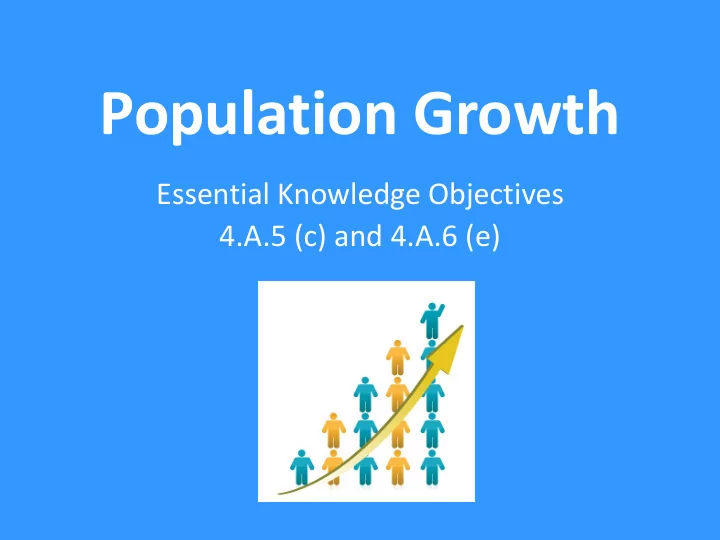
Population Growth Essential Knowledge Objectives 4.A.5 (c) and - - PowerPoint PPT Presentation

population growth
SMART_READER_LITE
LIVE PREVIEW

Population Growth Essential Knowledge Objectives 4.A.5 (c) and - - PowerPoint PPT Presentation

Population Growth Essential Knowledge Objectives 4.A.5 (c) and 4.A.6 (e) Population Growth Patterns Mathematical models and graphical representations are used to illustrate population growth patterns and interactions What are two


slide-1
SLIDE 1

Population Growth

Essential Knowledge Objectives 4.A.5 (c) and 4.A.6 (e)

slide-2
SLIDE 2

Population Growth Patterns

  • Mathematical models and graphical

representations are used to illustrate population growth patterns and interactions

  • What are two population growth patterns?
slide-3
SLIDE 3

Birth Rate and Death Rate

  • Birth rate (B): number of offspring produced

per unit time 34/1000 = 0.034 (per capita birth rate)

  • Death rate (D): number of individuals that die

per unit time 16/1000 = 0.016 (per capita death rate)

  • Used to estimate population growth
slide-4
SLIDE 4

Exponential Growth

  • Reproduction without constraints (such as?)
  • Rapid, unrestricted growth
  • rmax = max per capita growth rate
  • N = population size
slide-5
SLIDE 5

Logistic Growth

  • Growth is limited due to density-dependent

and density-independent factors

  • Rate of population growth slows as the

population size (N) approaches the carrying capacity (K)

slide-6
SLIDE 6

Logistic Growth

  • rmax = maximum growth rate of a population

under ideal conditions

  • K-N = number of individuals the environment

can support

  • (K-N)/K = fraction of the carrying capacity that

is still available for population growth

slide-7
SLIDE 7

Carrying Capacity (K)

  • The maximum number of individuals that a

given environment can support

slide-8
SLIDE 8

Limiting Factors

  • Factors that prevent a population from

growing any larger or cause a population to decrease What are the two categories of limiting factors?

slide-9
SLIDE 9

Density-Dependent Factors

  • Factors that are dependent on the number of

individuals in a given area (population size)

  • Often biotic factors

Examples: competition for resources, disease, predation

slide-10
SLIDE 10

Density-Independent Factors

  • Factors that affect all populations in similar

ways regardless of population size (density)

  • Often abiotic factors

Examples: drought, extreme temperatures, natural disasters

slide-11
SLIDE 11

Trade Offs and Life Histories

  • Traits that affect an organism’s schedule of

reproduction and survival make up its life history

  • Trade off between quantity (reproduction)

and quality of offspring (survival)

  • Natural selection decides

K-selection r-selection

slide-12
SLIDE 12

r and K Selected Species

slide-13
SLIDE 13

K-selected

  • K for carrying capacity
  • Population lives at a density near the carrying

capacity, stronger competition

  • Produce few “expensive” offspring and live in

stable environments

slide-14
SLIDE 14

r-selected

  • r for reproduction, maximize reproductive

success

  • Density of population is well below the

carrying capacity, minimal competition

  • Produce many “cheap” offspring and live in

unstable environments

slide-15
SLIDE 15

Life Histories