Population Mean and Standard Deviation In a population with N members - - PowerPoint PPT Presentation

population mean and standard deviation
SMART_READER_LITE
LIVE PREVIEW

Population Mean and Standard Deviation In a population with N members - - PowerPoint PPT Presentation

Population Mean and Standard Deviation In a population with N members Population mean: = x 1 + x 2 + . . . + x N N Population standard deviation: ( x 1 ) 2 + ( x 2 ) 2 + . . . + ( x N ) 2 = N MA202 Sections 5


slide-1
SLIDE 1

Population Mean and Standard Deviation

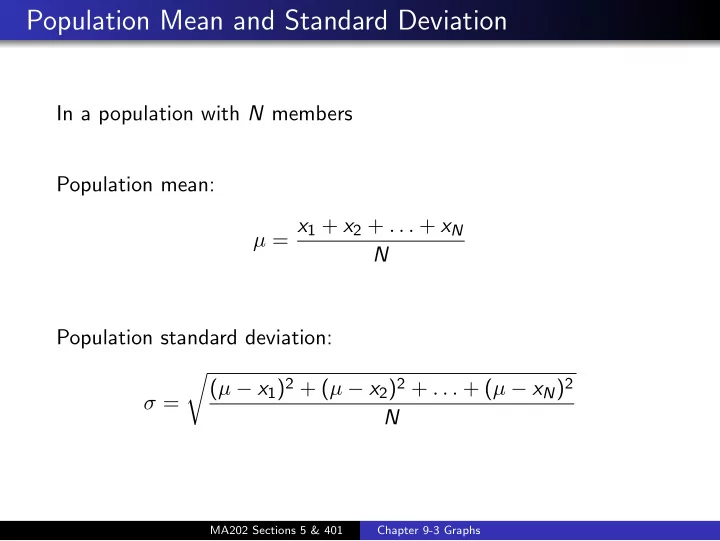
In a population with N members Population mean: µ = x1 + x2 + . . . + xN N Population standard deviation: σ =

  • (µ − x1)2 + (µ − x2)2 + . . . + (µ − xN)2

N

MA202 Sections 5 & 401 Chapter 9-3 Graphs

slide-2
SLIDE 2

Example 9.14

64 63 65 66 67 65 64 62 65 68 68 62 63 64 64 67 67 65 64 62 59 63 61 63 66 66 61 64 64 62 63 60 63 66 64 66 64 64 67 61 64 64 62 69 65 62 63 69 63 62 65 63 65 65 65 66 65 65 63 62 63 64 64 64 65 66 65 65 63 63 66 66 63 64 66 63 63 64 65 63 µ = 64 + 63 + . . . + 63 80 = 64.2 σ =

  • (64.2 − 64)2 + (64.2 − 63)2 + . . . + (64.2 − 63)2

80 = 1.9

MA202 Sections 5 & 401 Chapter 9-3 Graphs

slide-3
SLIDE 3

Sample Mean and Standard Deviation

In a sample with n members Sample mean: x = x1 + x2 + . . . + xn n Sample standard deviation: s =

  • (x − x1)2 + (x − x2)2 + . . . + (x − xn)2

n

MA202 Sections 5 & 401 Chapter 9-3 Graphs

slide-4
SLIDE 4

Example 9.15

We generate a sequence of random numbers: 5, 5, 2, 9, 1, 0, 4, 5, 3, 1, 2, 4, 1, 6, 6, 9, 1, 7 To choose our sample: 66 64 62 64 66 64 62 64 66 63 x = 66 + 64 + 62 + 64 + 66 + 64 + 62 + 64 + 66 + 63 10 = 64.1 s =

  • (64.1 − 66)2 + (64.1 − 64)2 + . . . + (64.1 − 63)2

10 = 1.45

MA202 Sections 5 & 401 Chapter 9-3 Graphs

slide-5
SLIDE 5

Relative Frequency

MA202 Sections 5 & 401 Chapter 9-3 Graphs

slide-6
SLIDE 6

Relative Frequency

MA202 Sections 5 & 401 Chapter 9-3 Graphs

slide-7
SLIDE 7

Relative Frequency vs Normal Distribution

MA202 Sections 5 & 401 Chapter 9-3 Graphs

slide-8
SLIDE 8

The 68-95-99.7 Rule for Normal Distributions

MA202 Sections 5 & 401 Chapter 9-3 Graphs

slide-9
SLIDE 9

Standardizing the Normal Distribution

MA202 Sections 5 & 401 Chapter 9-3 Graphs

slide-10
SLIDE 10

Standardizing the Normal Distribution

If we are measuring the weights of full-term newborn babies... What does a z-score of −1.75 indicate? What does a z-score of 0.15 indicate? What does a baby in the 85th percentile indicate?

MA202 Sections 5 & 401 Chapter 9-3 Graphs

slide-11
SLIDE 11

Class Discussion

If we want to determine where UK students live, and we choose every 250th student alphabetically. What is the population? Is the sample random? If Mitch McConnell wants voters opinions of his constituents, is a questionnaire sent to each one likely to be representative

  • f everyone? What if he sends it to a sample of registered

Republicans? If in fact, only 1 in 10 dentists recommend Whito Toothpaste, is it possible for them to advertise that 8 in 10 do? In the shoe business, which average of foot size is most important (mean, median or mode)?

MA202 Sections 5 & 401 Chapter 9-3 Graphs

slide-12
SLIDE 12

Homework

Homework 2 (due 2/9/09): Section 9.1 # 2, 8a, 9, 16, 18, 26, 34 Section 9.2 # 1, 3, 5b-e, 9, 13, 24, 33 Section 9.3 # 2, 11, 14, 17, 18, 31

MA202 Sections 5 & 401 Chapter 9-3 Graphs