
SLIDE 1
11/11/2014 1
COMPARING TWO PROPORTIONS
Chapter 21
1
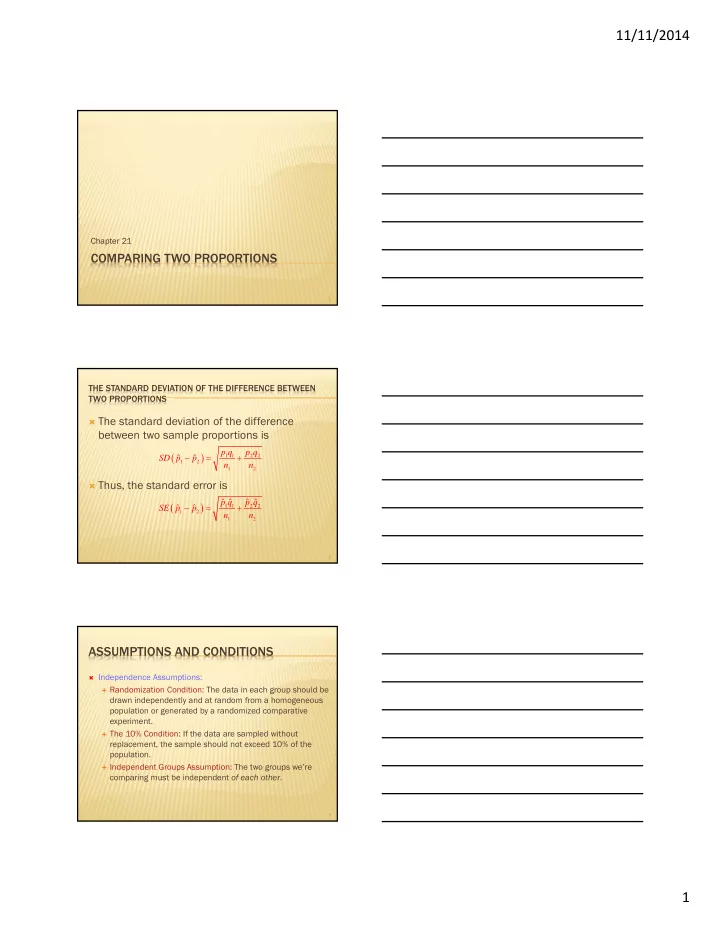
THE STANDARD DEVIATION OF THE DIFFERENCE BETWEEN TWO PROPORTIONS
The standard deviation of the difference
between two sample proportions is
Thus, the standard error is
1 1 2 2 1 2 1 2
ˆ ˆ p q p q SD p p n n
1 1 2 2 1 2 1 2
ˆ ˆ ˆ ˆ ˆ ˆ p q p q SE p p n n
2
ASSUMPTIONS AND CONDITIONS
Independence Assumptions: Randomization Condition: The data in each group should be
drawn independently and at random from a homogeneous population or generated by a randomized comparative experiment.
The 10% Condition: If the data are sampled without
replacement, the sample should not exceed 10% of the population.
Independent Groups Assumption: The two groups we’re
comparing must be independent of each other.
3