
SLIDE 1
1
Project Update Webinar June 18, 2020
Planning for Regional Transportation and Stormwater Management in - - PowerPoint PPT Presentation
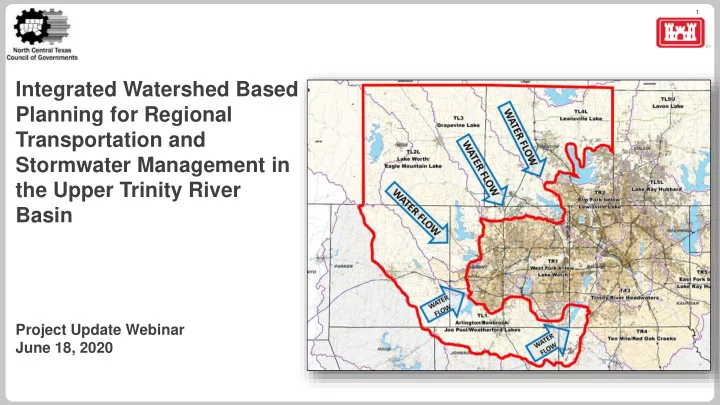
1 Integrated Watershed Based Planning for Regional Transportation and Stormwater Management in the Upper Trinity River Basin Project Update Webinar June 18, 2020 2 WELCOME 1) Everyone is muted 2) Please use the chat box to ask questions
1
Project Update Webinar June 18, 2020
2
3
4
Project initiated through partnership between NCTCOG and USACE Project Vision:
stormwater, and environmental infrastructure to address impacts of future growth in the project area. Many partners will be involved in this project:
5
2010-2019 Flood Related Fatalities
Source: NOAA/NWS
224 Median Recent Years
Frequency of Flooding Disasters
Source: NOAA 6
As development occurs, planning occurs for: ▪ Transportation infrastructure ▪ Wastewater infrastructure ▪ Water supply infrastructure ▪ Solid waste infrastructure But what about stormwater infrastructure:
impervious area
storage
watershed scale impacts
What about environmental infrastructure:
Case Study: Developing Area In North Fort Worth, Texas
Before After
7
Technologies to understand impacts of growth and development
also one of the most threatened
1990 – Trinity River DFW
Kazemi, Hamidreza (Kasra. (2014). Evaluating the /effectiveness and hydrological performance of green infrastructure stormwater control measures. 10.18297/etd1744
8
9
and development
analysis and data for transportation infrastructure
infrastructure
development
significant
cycle
10
States and Metropolitan Planning Organizations (MPOs) to consider resiliency in the transportation planning process
management serve complementary roles relating to resiliency
– City of Dallas (2019) – Pavements (11,775 lane-miles) 2006 City Council goal – 87% overall satisfaction rate; > 80% all districts November 2018 condition rating – 77% FY 2019-23 Infrastructure Maintenance Program (IMP) – 63% “Zero Degradation” – $1.66 billion shortage over 10 years
address infrastructure condition targets, as well as addressing lifecycle risks/stressors (e.g. flooding) at lowest practicable cost
Assessment and Adaptation Framework is an existing reference to guide and encourage comprehensive proactive planning
Meteorological Projections Land Use Projections Asset Data Riverine Hydrology Transportation Planning Environmental Review Engineering Design Transportation Systems Management and Operations Asset Management Articulate Objectives Define Study Scope Select and Characterize Relevant Assets Identify Key Environmental Variables Stakeholder Input Indicator-Based Desk Review Engineering-Informed Assessment
CON ONSIDER RISK
Multi-Criteria Analysis Economic Analysis
11
Freeways/Tollways and Arterials
Additional Roadway Capacity
HOV/Managed Lanes
Increase Auto Occupancy
Rail and Bus
Induce Switch to Transit
Growth, Development, and Land Use Strategies
More Efficient Land Use & Transportation Balance
Management, Operations and Technology
Improve Efficiency & Remove Trips from System Traffic Signals & Bicycle/Pedestrian Improvements
Infrastructure Maintenance
Maintain & Operate Existing Facilities Bridge Replacements
Total Expenditures 1
$ 37.5 $ 9.5 $ 3.2 $ 33.3 $ 52.0 Maximize Existing System Strategic Infrastructure Investment
Notes:
1 Actual dollars, in billions. Values may not sum due to independent rounding. 2 Balances to reasonably expected revenue, demonstrating financial constraint.
Public/Agency Involvement Asset Management Risk Management Performance Management Resiliency
12
Environmental Features and Tools Transportation Infrastructure and Safety Stormwater Runoff
City of Waxahachie DeSoto Fire Rescue Teague Nall and Perkins, Inc.
13
between 2020 and 2045
year floodplain (including lake area)
surface from 2006 to 2016
providers, 1 regional wastewater provider 32% 4% 60% 4%
Residential Developed Undeveloped Open Water
2015 Land Use (acres)
14
Collaborative Effort Complement Existing Programs Return on Investment
Address Existing Challenges with Flood Reduction Efforts
Comprehensive Planning
infrastructure before expected population growth
Complementing Existing Regional Programs North Central Texas Council of Governments Common Vision Program
Certificate (CDC)
Long-Range Transportation Planning Process Compliance with State Laws Creating Positive Financial Outcomes
for every $1 invested*
*2017 “Natural Hazard Mitigation Saves” (National Institute of Building Sciences Multi-hazard Mitigation Council)
Creation of Resources and Tools to Support Communities
modeling
15
Implementation (Products and Technical Tools) Project Management and Organization Plans to Offset Future Transportation and Indirect Development Impacts Land Inventory and Site-Specific Design Considerations Inventory of Stormwater Management Structures Inventory of Relevant Data
PROJECT TASKS & COST COMPONENTS ANTICIPATED MAJOR PROJECT ELEMENTS STAKEHOLDER ENGAGEMENT
16
Transportation Infrastructure
Elevation/ Culverts/ Model Growth
“LEED” like certified transportation facilities
widths/ detention
integrating routing
prioritization to address low-lying structures Flood Reduction
(meteorology, hydrology, hydraulics)
scenarios to assess flooding impacts through 2055
cities and counties
areas
detention areas Environmental Stewardship
stormwater infrastructure plan
and other key natural areas
areas/ wetland banking
recreational assets
define areas for implementation and return on investment, stormwater reduction and other benefits Other Planning Tools to Analyze and Mitigate Risk
infrastructure plans
(HazMAP integration)
(Comprehensive plans,
connected open space plans
as City of Austin’s Floodpro.com, FPTool.org, etc.
tools (CHARM, EEBS, and others) to establish trade-offs
(planning tools,
etc.)
impact tools
17
REPLICATE INITIATE PLANNING WORK Beginning initial stakeholder engagement in FY2021 FUNDING
roundtable Summer 2019
state and federal agencies SCOPE AND SCHEDULE
developed
project PARTNERSHIPS AND WORKING GROUP Federal, State, Local governments, Water providers, Universities
NCTCOG AND PARTNERS ARE HERE
18
Early 2020 Submitted Comments to General Land Office/Collaboration with Texas Water Development Board (TWDB) and Other Funding Partners/USACE Funding Request/FEMA Base Level Engineering June 15 NCTCOG Submitted Abridged Application to TWDB April/May 2020 Partner Group Developed Scope of Work TWDB Released Flood Infrastructure Fund Abridged Application July 2019 Congressional Delegation on Project Concept 2019 Presentations to Various Audiences 2018 Concept Development March 2019 NCTCOG Member Update at NCTCOG Offices
19
SUBMITTED APPLICATIONS ANTICIPATED/REQUESTED FUNDS OR APPLICATIONS*
Funding Agency/ Funding Opportunity Name TWDB (Flood Infrastructure Fund) USACE (Various Authorities) FEMA (Community Outreach and Mitigation Strategies) Regional Transportation Council (Transportation Planning Dollars) General Land Office (CDBG MIT or Other Funding Category) Requested Funding $3.0 Million $3.0 Million $80,000 $3.0 Million ? Current Status Submitting Abridged Application on June 15, 2020 Submitted to USACE Fort Worth District in March/Expect to hear June/July 2020 Submitted to FEMA in June; Phase 1 engagement to begin 01/1/2021 Included in Unified Planning Work Program Anticipated Applications in FY2021
*Anticipate applying to additional funding opportunities as they become available (ex. FEMA BRIC, GLO, TDEM, etc.) and working with partner organizations to identify project funding.
20
PHASE 1 Initial Engagement Process
higher standards in floodplain ordinances, etc.) PHASE 2 Maintaining Engagement PHASE 3 Project Completion and Implementation HERE NOW (June 2020) FY2021 – FY2022*
*Estimated Timeframe
FY2023 – FY2024* FY2025*
21
1) Continue to apply for project funding 1) Formal full application to TWDB (if invited to apply) 2) General Land Office 3) Others as applications open 2) Begin Phase 1 of engagement activities with partners (Estimated January 2021) 3) Begin project efforts as funding becomes available:
do want to leverage and build upon for this Project
Mary’s Creek, Harriet Creek, and Catherine Branch (ongoing or future projects)
22
NCTCOG Edith Marvin, P.E. Michael Morris, P.E. 817-695-9211 817-695-9241 emarvin@nctcog.org mmorris@nctcog.org Tamara Cook, AICP, LEED GA Jeff Neal, PTP 817-695-9221 817-608-2345 tcook@nctcog.org jneal@nctcog.org U.S. Army Corps of Engineers Jerry Cotter, P.E. 817-886-1549 Jerry.L.Cotter@USACE.army.mil