
SLIDE 1
photographs Roger Morris Hoverfly Recording Scheme - - PowerPoint PPT Presentation
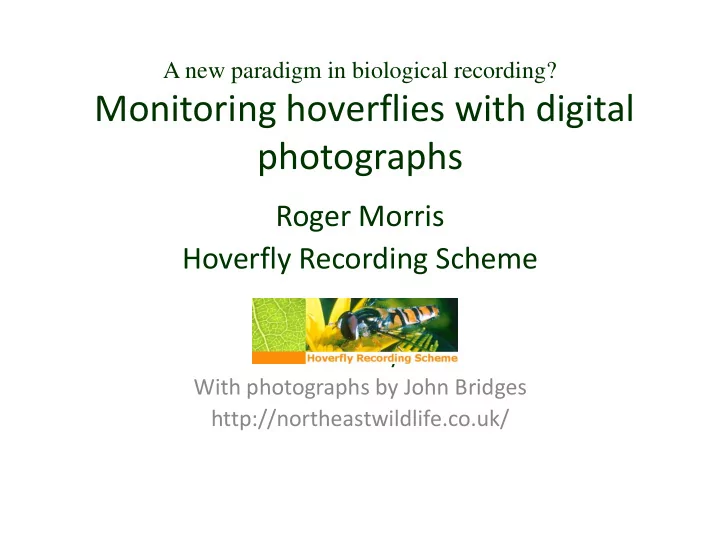
A new paradigm in biological recording? Monitoring hoverflies with digital photographs Roger Morris Hoverfly Recording Scheme www.hoverfly.co.uk With photographs by John Bridges http://northeastwildlife.co.uk/ What is a hoverfly? Order:
Photo Stuart Ball
and decaying wood;
larvae; and
social wasps and ants.
Myathropa florea
Chrysotoxum arcuatum
want to retain specimens.
knowledge about wildlife but lack the experience to tackle difficult taxa.
Meligramma guttatum
Episyrphus balteatus
Cheilosia grossa – photographic data
Helophilus pendulus
Tribe GB Fauna Species recorded % GB fauna in sample Identified records Unidentified records Total records % Identified
Volucellini 5 5 100 886 5 891 99.4 Xylotini 20 14 70 647 11 658 98.3 Eristalini 28 19 67.9 3488 380 3868 90.2 Callicerini 3 2 66 4 4 100 Syrphini 84 45 53.6 3352 1031 4378 76.6 Bacchini 30 15 50 860 291 1158 74.3 Cheilosini 43 17 39.5 634 170 804 78.9 Chrysogastrini 29 10 34.5 108 49 157 68.8 Merodontini 7 2 28.6 188 15 203 92.6 Microdontinae 4 1 25 1 1 100 Pipizini 20 3 15 9 63 72 12.5 Paragini 4 4 Pelecocerini 3
HRS species per hectad 2014 Photographic coverage 2014 Photographic data species per hectad
Phenology of Episyrphus balteatus in 2013 and 2014 2013 2014
North Midlands South Phenology of Epistrophe eligans in 2014
visits, predation,
Volucella zonaria Male Volucella zonaria Female