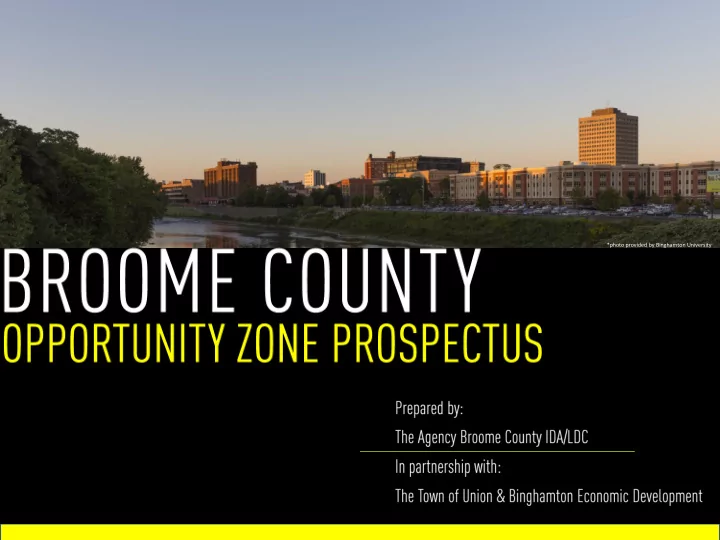

*photo provided by Binghamton University
✓ The Opportunity Zones incentive is a new community investment tool established by Congress in the Tax Cuts and Jobs Act of 2017 to encourage long-term investments in low-income urban and rural communities nationwide. ✓ Opportunity Zones provide a tax incentive for investors to re-invest their unrealized capital gains into dedicated Opportunity Funds. ✓ An Opportunity Zone is a low income census (LIC) tract with an individual poverty rate of at least 20% and median family income no greater than 80% of the area median.
The Opportunity Zones program offers three tax incentives for investing in low-income communities through a qualified Opportunity Fund. *Courtesy of Economic Innovation Group
The Tax Cuts and Jobs Act of 2017 established new Internal Revenue Code 1400Z - Opportunity Zones There are 4 parties in an Opportunity Zone transaction: Different Than Other Tax Credits: Qualified Taxpayer ✓ More market-oriented Zone ✓ Residential, commercial real estate, and business investments ✓ No benefit cap Projects Opportunity (Property & Fund Business)
✓ Opportunity Funds must be classified as a corporation or partnership for income tax purposes, meaning a limited liability company (LLC) can qualify. Opportunity Funds must also be created or organized in one of the 50 U.S. states, DC, or a U.S. territory. ✓ Pre-existing entities can qualify as Opportunity Funds or Opportunity Zone businesses, as long as they satisfy the necessary requirements. ✓ Opportunity Funds will be able to choose the first month in which they are treated as an Opportunity Fund. The last day of the fund’s taxable year is a test date for the 90-percent asset test. ✓ An Opportunity Fund must value its assets for purposes of the 90-percent asset test using values reported on the fund’s audited or filed financial statements (or using the cost of the assets, if it does not have them). ✓ Though Opportunity Zone designations expire at the end of 2028, taxpayers may continue to hold Opportunity Fund interests invested in those zones and still may step up the basis of their Opportunity Fund investments to fair market value if they hold the investments for ten years.
*Map picture provided by Census Reporter ENDICOTT Areas Poverty Labor Median Educational Status statistics Household Attainment ✓ Highest population density of (% in (% Income (% who all six OZ tracts 2017) unemployed (2017) obtain in 2017) College in 2017) ✓ Nearby attractions: Little Italy Commercial District, North Census 12.9% 14.6% $36,192 55% Tract 134 Side Park Broome 17.1% 4.2% $49,064 40.6% County U.S. 14.6% 4.1% $57,652 39.2%
*Map picture provided by Census Reporter ENDICOTT Areas Poverty Labor Median Educational ✓ Includes Huron Campus and Status statistics Household Attainment BAE Systems (% in (% Income (% who 2017) unemployed (2017) obtain in 2017) College in ✓ Included in the Endicott 2017) iDistrict Census 34.8% 5.1% $21.333 12.4% Tract 135 ✓ Nearby attractions: Broome 17.1% 4.2% $49,064 40.6% Washington Ave. Commercial County District, North Brewery U.S. 14.6% 4.1% $57,652 39.2%
*Map picture provided by Census Reporter JOHNSON CITY Areas Poverty Labor Median Educational Status statistics Household Attainment ✓ This tract is identified as the (% in (% Income (% who Johnson City iDistrict and JC 2017) unemployed (2017) obtain Health & Cultural District in 2017) College in 2017) ✓ Anchor Institutions: Census 30.3% 5.1% $32,470 27.6% Tract 139 UHS/Wilson Hospital; Binghamton University School Broome 17.1% 4.2% $49,064 40.6% County of Pharmacy U.S. 14.6% 4.1% $57,652 39.2%
*Map picture provided by Census Reporter BINGHAMTON Areas Poverty Labor Median Educational Status statistics Household Attainment ✓ Part of the First Ward BOA, (% in (% Income (% who 2017) unemployed (2017) obtain includes Charles Street in 2017) College in Business Park 2017) Census 31.8% 11.2% $25,425 17.9% ✓ Nearby attraction: Antique Tract 2 Row, Boys & Girls Club Broome 17.1% 4.2% $49,064 40.6% County U.S. 14.6% 4.1% $57,652 39.2%
BINGHAMTON Areas Poverty Labor Median Educational ✓ River frontage along Chenango Status statistics Household Attainment River (% in (% Income (% who 2017) unemployed (2017) obtain in 2017) College in ✓ Nearby attractions: Otsiningo 2017) Park, Downtown Binghamton Census 31.3% 8.8% $25,00 16.5% Tract 4 ✓ Part of the Brandywine BOA, Broome 17.1% 4.2% $49,064 40.6% includes Stow Manufacturing County U.S. 14.6% 4.1% $57,652 39.2%
*Map picture provided by Census Reporter BINGHAMTON Areas Poverty Labor Median Educational ✓ River frontage along Chenango Status statistics Household Attainment River (% in (% Income (% who 2017) unemployed (2017) obtain in 2017) College in ✓ Nearby attractions: Otsiningo 2017) Park, Downtown Binghamton Census 53.8% 9.9% $20,052 42.4% Tract 5 ✓ Part of the Brandywine BOA, Broome 17.1% 4.2% $49,064 40.6% includes Stow Manufacturing County U.S. 14.6% 4.1% $57,652 39.2%
Recommend
More recommend