
SLIDE 1
Phosphorus Compliance Plan By: Tim Nennig (Village of Grafton), Jon - - PowerPoint PPT Presentation
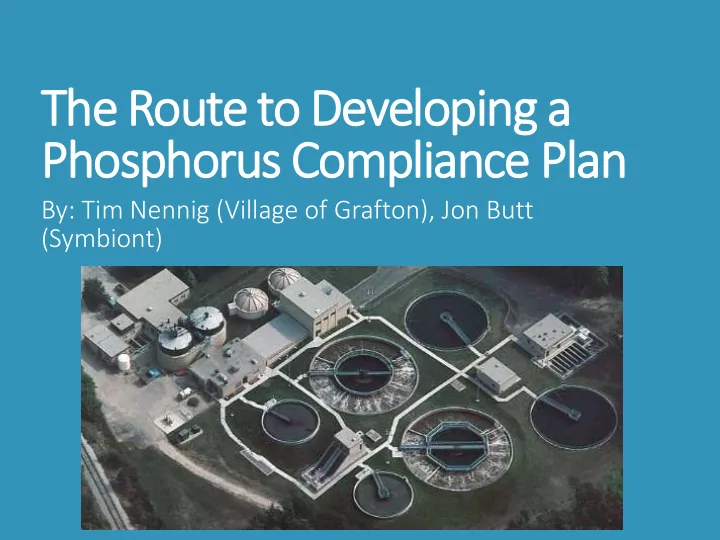
The Route to Developing a Phosphorus Compliance Plan By: Tim Nennig (Village of Grafton), Jon Butt (Symbiont) Agenda 1. Background 2. WPDES Permit Requirements 3. Preliminary Alternatives 4. The final plan 5. Next steps Background
Gr Grafton WWTP
Total Phosphorus Month Monthly Mass (lb) Days per Month Daily Average (lb/day) January 91.29 31 2.94 February 95.53 28 3.41 March 87.07 31 2.81 April 88.55 30 2.95 May 96.38 31 3.11 June 96.49 30 3.22 July 86.83 31 2.80 August 84.04 31 2.71 September 86.50 30 2.88 October 72.21 31 2.33 November 88.49 30 2.95 December 82.55 31 2.66 Annual Limit 1,055.94
TMDL Compliance
equivalent to meet the WQBEL
associated with a 35-year-old treatment plant but future sewer rate increases can not be included in the financial analysis – sewer rates with improvements for TP WQBEL compliance < 1% of the MHI
Type of Ag Operation % of Land Acres of Ag type Baseline P (acres) (lb/yr) Cash Grain 40% 10,000 70,066.6 Dairy 40% 10,000 30,672.9 CAFO 20% 5,000 20,325.0 Total 25,000 121,064.5
to meet TMDL obligations Long term trades possible on the remaining 10 to 15%. 100% Phosphorus reductions only possible if land is removed from production (Baker Cheese trade) Trading does not appear viable until more clarification is provided on trading within TMDL areas.
improvements
Management
$400K – depending on the year
$30K/yr
can change your mind!
criteria – it is worth it a try to see if it can be lowered
upgrades or trading
Village
the plan
cost to the Village
Location Reduction Target Lb/yr Mole Creek & Milwaukee River within the action area 1,000 Milwaukee River upstream from action area 5,160 Treatment Plant 1,280 Total 7,440
The Village has committed up to $5,000 per farm up to 4 farms to: Plant cover crops in the fall of 2019 To practice no till The Village has pledged this support for 2019-2020 and 2020- 2021. This work is being done in conjunction with Ozaukee County and the Milwaukee River Watershed Clean Farm Families.
Make an improvement Collect Data Analyze the data
application
2020
partners Spring 2020
the action area throughout 2020