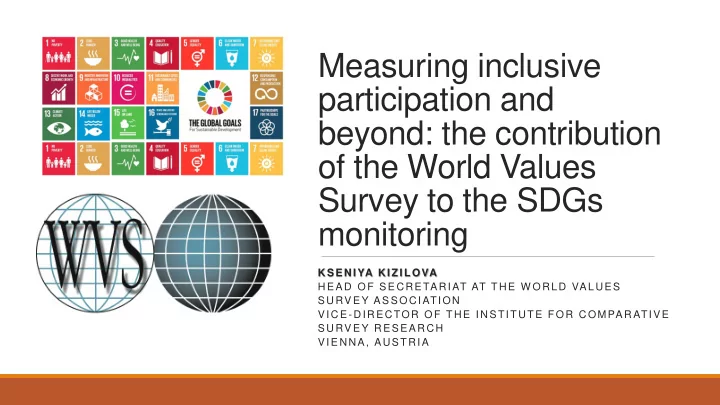
participation and
play

participation and beyond: the contribution of the World Values - PowerPoint PPT Presentation

Measuring inclusive participation and beyond: the contribution of the World Values Survey to the SDGs monitoring KSENIYA KIZILOVA HEAD OF SECRETARIAT AT THE W ORLD VALUES SURVEY ASSOCIATION VICE-DIRECTOR OF THE INSTITUTE FOR COMPARATIVE


  1. Measuring inclusive participation and beyond: the contribution of the World Values Survey to the SDGs monitoring KSENIYA KIZILOVA HEAD OF SECRETARIAT AT THE W ORLD VALUES SURVEY ASSOCIATION VICE-DIRECTOR OF THE INSTITUTE FOR COMPARATIVE SURVEY RESEARCH VIENNA, AUSTRIA

  2. Introduction to the World Values Survey The World Values Survey (WVS) is a global cross-national cross-sectional research program exploring human values and beliefs, their stability or change over time, and how they influence social, political and economic development of societies around the globe. Largest non-commercial academic High-quality national-wide random social survey program: covers 115 representative samples (1200 to countries representing 92% of the 6000 respondents per country); world population interviews in face to face mode Time-series data for 38-years (1981- Collaboration of over 400 highly 2019), over 700 indicators professional national survey teams measured in this period worldwide Free access to the data for Over 15 000 publications, including researchers, civil society, academic articles and books, working international development agencies: papers, development reports www.worldvaluessurvey.org

  3. World Values Survey geographic coverage (1981-2019): 115 countries

  4. Some of the WVSA cooperation initiatives and partnerships (2014-2019) Examples of global development reports that employ WVS data

  5. WVS data for the SDGs measurement SDG Target 16.5: Substantially reduce ▪ WVS survey contains 200+ indicators valid for corruption and bribery in all their forms monitoring SDGs 1, 2, 3, 4, 5, 6, 8, 9, 10, 11, 2.70 13, 16, 17 as supplement measures. BOLIVIA BANGLADESH SERBIA ECUADOR ▪ Frequency ordinary people pay a bribe High quality samples: extrapolation of findings PAKISTAN 2.50 PERU LEBANON NIGERIA on the total country adult population. ROMANIA IRAQ MALAYSIA ▪ Possibility of disaggregation by age, gender, 2.30 EGYPT GREECE education, wellbeing, social class, migration SOUTH background, region of residence, type of KAZAKHSTAN 2.10 PUERTO RICO KOREA RUSSIA settlement. BRAZIL CHILE USA 1.90 ▪ Possibility of cross-country and cross- ANDORRA ARGENTINA THAILAND regional comparison for the same measures; 1.70 JORDAN AUSTRALIA ▪ All data in free access for individuals and organizations (HEIs, IDAs, CSOs, NGOs etc.) INDONESIA 1.50 for any non-commercial purpose of use; GERMANY ▪ Wide network of national research teams to 1.30 5.50 6.00 6.50 7.00 7.50 8.00 8.50 9.00 9.50 10.00 explore national context and engage with Perceived scale of corruption CSO/NGO actors. Source: World Values Survey (2017-2019); www.worldvaluessurvey.org

  6. SDG Target 16.1: Significantly reduce all forms of violence and related death rates everywhere GEORGIA 3.85 UZBEKISTAN FREQUENCY OF ROBBERIES IN THE NEIGHBOURHOOD AZERBAIJAN ANDORRA SINGAPORE CHINA QATAR GERMANY TAIWAN SLOVENIA POLAND 3.65 EGYPT CYPRUS BANGLADESH NETHERLANDS ESTONIA SOUTH KOREA JAPAN ROMANIA INDONESIA JORDAN 3.45 ARMENIA SWEDEN SERBIA BELARUS LIBYA GHANA YEMEN TURKEY RUSSIA SPAIN 3.25 UKRAINE KUWAIT HONG KONG KYRGYZSTAN IRAQ THAILAND PAKISTAN RWANDA KAZAKHSTAN LEBANON 3.05 USA INDIA TUNISIA MOROCCO NEW ZEALAND GREECE NIGERIA AUSTRALIA ZIMBABWE BOLIVIA 2.85 MALAYSIA COLOMBIA HAITI ECUADOR ALGERIA 2.65 URUGUAY PERU PHILIPPINES ARGENTINA MEXICO CHILE 2.45 SOUTH AFRICA BRAZIL 2.25 2.00 2.20 2.40 2.60 2.80 3.00 3.20 3.40 3.60 3.80 PERCEIVED SECURITY IN THE NEIGHBOURHOOD Source: World Values Survey (2014-2019); www.worldvaluessurvey.org

  7. SDG Target 16.6: Develop effective, accountable and transparent institutions at all levels 3.00 China Indonesia Bangladesh Singapore Uganda Tanzania Ghana Kazakhstan Luxembourg India Mali Switzerland 2.80 Philippines Thailand Iceland Estonia Azerbaijan Kuwait Denmark Rwanda Kyrgyzstan Germany Malaysia Russia Georgia Sweden France Turkey Taiwan Austria 2.60 Pakistan Norway CONFIDENCE IN CIVIL SERVICE Belgium Zimbabwe South Korea Netherlands Canada Argentina Slovakia Montenegro Spain Andorra South Africa Morocco Macedonia New Zealand Nigeria Zambia Australia Libya 2.40 Finland Portugal Cyprus Moldova UK Brazil Iran Greece Ukraine Hungary Poland Italy USA Lithuania Algeria Ethiopia Japan 2.20 Czechia Belarus Chile Armenia Tunisia Croatia Bulgaria Iraq Slovenia 2.00 Romania Serbia Egypt Uruguay Argentina Colombia Mexico Bolivia 1.80 Lebanon Yemen Guatemala Ecuador 1.60 Peru 1.40 1.80 2.00 2.20 2.40 2.60 2.80 3.00 3.20 3.40 CONFIDENCE IN POLICE Source: World Values Survey (2014-2019); www.worldvaluessurvey.org

  8. How much would you say the political system in your country allows Pilot of tier III indicator 16.7.2: Proportion people like you to have a say in what the government does? of population who believe (“a great deal” + “a lot” in %) decision-making is inclusive and responsive, by population group Italy 89.8% 15.5% Egypt Slovenia 83.6% Brazil 17.9% ▪ Implemented as a part of cooperation Estonia 74.0% 18.3% Australia agreement between the UNDP and the Argentina 73.5% Lebanon 25.1% WVSA . Russia 71.1% Switzerland 25.6% ▪ Pilot of the measure on inclusive and Lithuania 71.0% 29.6% Iraq responsive decision-making in 2018-2020 Spain 70.8% Norway 31.4% conducted in 40 countries. Poland 69.7% 33.8% Nigeria ▪ In every country representative national Israel 69.3% Indonesia 41.2% samples are interviewed; item translated so France 68.0% Jordan 41.5% far into 17 languages . Ireland 67.4% Pakistan 41.5% ▪ Data collected via face-to-face interview Hungary 66.7% Malaysia 43.5% method (PAPI; CAPI modes). Portugal 63.9% 46.2% Andorra ▪ Possibility of data disaggregation by Austria 63.9% Netherlands 46.4% population group and location. Finland 63.8% 49.6% Germany ▪ Study of correlations with measures of Belgium 63.1% Iceland 50.1% democracy, voting and other forms of political Czechia 61.9% 53.1% Sweden participation, confidence in institutions etc. UK 54.6% Source: World Values Survey (2017-2019); European Social Survey 8 (2016)

  9. Proportion of adult population in Bangladesh who believe Males 53.70% decision-making is inclusive and responsive, by population Females 45.80% groups and region (%) 18-29 years 49.10% 30-45 years 51.70% 46-99 years 47.50% Primary, secondary 43.80% education Tertiary education 58.70% Low income 56.40% Medium income 50.10% High income 42.30% Urban 46.50% Rural 50.70% Source: World Values Survey in Bangladesh (2018); www.worldvaluessurvey.org

  10. Proportion of adult population in Malaysia who believe decision-making is inclusive and responsive, by population groups and regions (%) 59.10% 46.50% 46.50% 46.30% 45.80% 45.50% 43.40% 42.50% 37.10% 36.80% 34.30% 31.10% Males Females 18-29 30-49 50 and Primary, Tertiary Low Medium High Urban Rural years years older secondary education income income income education Source: World Values Survey in Malaysia (2018); www.worldvaluessurvey.org

  11. Proportion of adult population in Pakistan who believe Males 41.60% decision-making is inclusive and responsive, by population Females groups and regions (%) 41.30% 18-25 years 47.80% 26-40 years 40.50% 41-99 years 39.10% Primary, secondary 40.30% education Tertiary education 45.70% Low income 38.80% Medium income 41.80% High income 48.40% Urban 43.70% Rural 40.40% Source: World Values Survey in Pakistan (2018); www.worldvaluessurvey.org

  12. Perceptions of inclusive and responsive decision-making and reported forms of political participation and civil activity (%) Political system responsiveness: Very much or a lot Some Little or no 64.1 60.7 61.1 29.2 28.5 28.0 26.1 26.7 25.9 25.7 25.7 24.9 22.2 21.3 18.3 17.1 14.0 13.6 Voted in last Donated to a group Searched Encouraged others Signed a petition Contacted a elections or campaign information about to vote government official politics online 14.7 14.4 14.2 13.5 11.5 11.3 10.6 11.2 10.1 9.0 8.6 6.8 7.0 6.3 6.0 6.0 3.8 3.7 Attended peaceful Signed an e-petition Encouraged others Joined a strike Organized a event, Joined in boycott demonstration to take an action protest using social about political issue media Source: World Values Survey (2017-2019); www.worldvaluessurvey.org

  13. Key methodological findings from the pilot Variation in interpretation of “having a say” which affects the translation and the overall question meaning in other languages => remark for translators required; In most languages, very close distance between scale positions 1=Very much; 2=A lot => difficulty to reproduce the required difference between the two points; Item is a valid measure of external efficacy, responses correlate highly with the perceived satisfaction with democracy and the way political system is developing in the country, confidence in the government; Question was possible to ask in all countries regardless of the type of political regime, in less democratic countries the respondents more often tend to select “hard to say” or “refuse to answer” (up to 20%) => consider developing supplementary measures.

Download Presentation
Download Policy: The content available on the website is offered to you 'AS IS' for your personal information and use only. It cannot be commercialized, licensed, or distributed on other websites without prior consent from the author. To download a presentation, simply click this link. If you encounter any difficulties during the download process, it's possible that the publisher has removed the file from their server.

Recommend


More recommend