
SLIDE 1
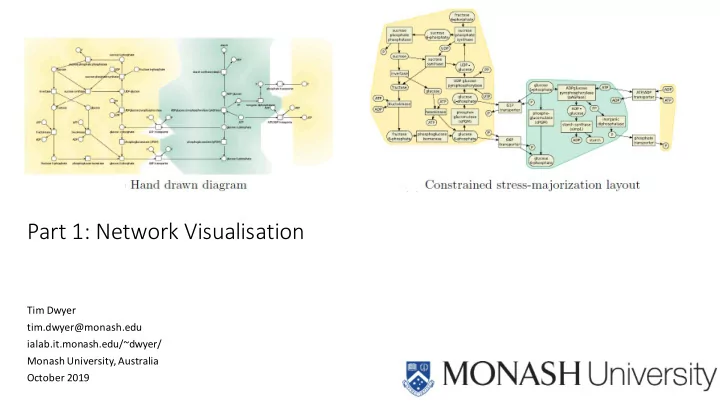
Part 1: Network Visualisation
Tim Dwyer tim.dwyer@monash.edu ialab.it.monash.edu/~dwyer/ Monash University, Australia October 2019
Part 1: Network Visualisation Tim Dwyer tim.dwyer@monash.edu - - PowerPoint PPT Presentation
Part 1: Network Visualisation Tim Dwyer tim.dwyer@monash.edu ialab.it.monash.edu/~dwyer/ Monash University, Australia October 2019 projects.icij.org/ panama-papers/ power-players Atlas of economic complexity Network Earth Keystone taxa as
Tim Dwyer tim.dwyer@monash.edu ialab.it.monash.edu/~dwyer/ Monash University, Australia October 2019
projects.icij.org/ panama-papers/ power-players
Atlas of economic complexity
Network Earth
Keystone taxa as drivers of microbiome structure and functioning, Banerjee et al. 2018
Kim Marriott Michael Wybrow Steve Kieffer Karsten Klein Uni Konstanz Chunlei Chang Vahan Yoghourdjian General Assembly Nathalie Henry Riche Microsoft Research Benjamin Bach Uni Edinburgh Kun-Ting Chen Graeme Gange Peter Stuckey Yalong Yang, Harvard Yehuda Koren Google Bongshin Lee Microsoft Research Sheelagh Carpendale Simon Fraser Uni George Robertson Microsoft Research
Tim Dwyer, Yehuda Koren, and Kim Marriott. "IPSep-CoLa: An incremental procedure for separation constraint layout of graphs." IEEE Transactions on Visualization and Computer Graphics 12.5 (2006): 821-828.
stress(X)
(x,y)* x* y* x* y*
Instead of solving unconstrained quadratic forms we
solve subject to separation constraints
i.e. Quadratic Programming stress(X)
x* y* x* y* (x,y)*
x0 x1
x1
d x2 x1 β d
x*
Tim Dwyer, Yehuda Koren IEEE Symposium on Information Visualization, 2005. INFOVIS 2005, 65-72
(x1,y1) (x2,y2) (x3,y3) w1 w2 h2 h3
x1 + ≤ x2 (w1+w2) 2 y3 + ≤ y2 (h2+h3) 2
Fast node overlap removal T Dwyer, K Marriott, PJ Stuckey International Symposium on Graph Drawing, 153-164, 2005
“Unix” Graph data From www.graphviz.org
Tim Dwyer, Yehuda Koren, and Kim Marriott. "IPSep-CoLa: An incremental procedure for separation constraint layout of graphs." IEEE Transactions on Visualization and Computer Graphics 12.5 (2006): 821-828.
Topology preserving constrained graph layout T Dwyer, K Marriott, M Wybrow International Symposium on Graph Drawing, 230-241, 2008
https://ialab.it.monash.edu/webcola
Tim Dwyer, Network Visualization as a Higher-Order Visual Analysis Tool IEEE computer graphics and applications 36(6), pp. 78-85, 2016.
Dwyer, Tim, Nathalie Henry Riche, Kim Marriott, and Christopher Mears. "Edge compression techniques for visualization of dense directed graphs." IEEE transactions on visualization and computer graphics 19, no. 12 (2013): 2596-2605.
Dwyer, Tim, Nathalie Henry Riche, Kim Marriott, and Christopher Mears. "Edge compression techniques for visualization of dense directed graphs." IEEE transactions on visualization and computer graphics 19, no. 12 (2013): 2596-2605.
9 Edges
Improved Optimal and Approximate Power Graph Compression for Clearer Visualisation of Dense Graphs T Dwyer, C Mears, K Morgan, T Niven, K Marriott, M Wallace Pacific Visualization Symposium (PacificVis), 2014 IEEE, 105-112
Yoghourdjian, V., Dwyer, T ., Gange, G., Kieffer, S., Klein, K., & Marriott, K. High-quality ultra-compact grid layout of grouped networks. IEEE Transactions on Visualization and Computer Graphics, 22(1), 339-348. 2015
Kieffer, S., Dwyer, T., Marriott, K., & Wybrow, M. Hola: Human-like orthogonal network layout. IEEE transactions on visualization and computer graphics, 22(1), 349-358. 2015
Vahan Yoghourdjian, Tim Dwyer, Karsten Klein, Kim Marriott, and Michael Wybrow Graph Thumbnails: Identifying and Comparing Multiple Graphs at a Glance IEEE Transactions on Visualization and Computer Graphics, 2018
Vahan Yoghourdjian, Tim Dwyer, Karsten Klein, Kim Marriott, and Michael Wybrow Graph Thumbnails: Identifying and Comparing Multiple Graphs at a Glance IEEE Transactions on Visualization and Computer Graphics, 2018
Hard Easy
Density Τ (|𝐹| |𝑊|) = 2 Density = 4 Density = 6 Nodes (|𝑊|)
Hardness model Graph size Local measures Clutter (crossings) Cognitive Scalability of Network Visualisation Vahan Yoghourdjian, Yalong Yang, Lee Lawrence, Michael Wybrow, Tim Dwyer, Kim Marriott
Maxime Cordeil
Andrew Cunningham
UniSA Yalong Yang Peter Hoghton Kim Marriott Bruce Thomas UniSA
Tobias Czauderna
Matthias Klapperstueck Benjamin Bach Falk Schreiber Bernie Jenny Sarah Goodwin Barrett Ens
Niklas Elmqvist
Uni Maryland
Andrea Batch Uni Maryland
Benjamin Lee
64
65
Feb. Mar. Jun. Oct. Nov. Oct. Nov. Dec.
Published 2018
Cordeil, Dwyer, Klein, Laha, Marriott, Thomas IEEE Transactions on Visualization and Computer Graphics 2016
HMDs records
CAVE2 records
ImAxes: Immersive axes as embodied affordances for interactive multivariate data visualisation. Cordeil, M., Cunningham, A., Dwyer, T ., Thomas, B. H., & Marriott, K. In Proc. ACM Symp. on User Interface Software and Technology (pp. 71-83). ACM UIST 2017
CHLORIDES DENSITY RESIDUAL SUGARS ACIDITY
VOLATILE ACIDITY FIXED ACIDITY ALCOHOL TYPE SULFUR DIOXIDE QUALITY SULPHATES
Parallel coordinates Scatterplot Matrix
* Dourish, P. (2004) ** DA Norman (2002)
83
There Is No Spoon: Evaluating Performance, Space Use, and Presence with Expert Domain Users in Immersive Analytics. Batch A, Cunningham A, Cordeil M, Elmqvist N, Dwyer T, Thomas BH, Marriott K. IEEE Transactions on Visualization and Computer Graphics, 2019
86